Herramientas generales
- Teclas de acceso rápido
- Ayuda de contexto
- Renderizado
- Selector de color
- Modos de Mezcla
- Zooming and Panning
- Mediciones
- Seleccionar y deseleccionar objetos espaciales
- Data defined override setup
- Identificar objetos espaciales
- Herramientas de anotaciones
- Marcadores espaciales
- Anidar proyectos
- Elementos decorativos
- Autenticación
- Guardar capa en archivo
- Use of variables for dynamic content
Teclas de acceso rápido
QGIS proporciona atajos de teclado predeterminados para muchas características. Puede encontrarlos en la sección Barra de Menú. Además, la opción de menú Configuración ‣ Configurar atajos de teclado... permite cambiar los atajos de teclado predeterminados y agregar otros nuevos a las características de QGIS.
Figure Shortcuts 1:

Definir opciones de atajo
Configuration is very simple. Just select a feature from the list and click on :
- [Change] and press the new combination you want to assign as new shortcut
- [Set none] to clear any assigned shortcut
- or [Set default] to backup the shortcut to its original and default value.
Once you have finished your configuration, you can save it as an XML file and load it to another QGIS installation.
Ayuda de contexto
Cuando necesite ayuda sobre un tema especifico, puede acceder a la ayuda de contexto mediante el botón [Ayuda] disponible en la mayoría de diálogos – tenga en cuenta que los complementos de terceros pueden apuntar a paginas web dedicadas.
Renderizado
By default, QGIS renders all visible layers whenever the map canvas is refreshed. The events that trigger a refresh of the map canvas include:
Añadir una capa
Desplazar o hacer zoom
Redimensionando la ventana QGIS
Cambiar la visibilidad de una o varias capas
QGIS le permite controlar el proceso de representación de varias maneras.
Renderizado dependiente de la escala
El renderizado dependiente de la escala le permite especificar las escalas mínima y máxima a las que una capa será visible. Para establecer el renderizado dependiente de la escala, abra el diálogo Propiedades mediante doble clic en una capa en el panel Capas. En la pestaña General, haga clic en la casilla  Visibilidad dependiente de la escala para activar la característica, luego establezca los valores mínimo y máximo de escala.
Puede determinar los valores de escala haciendo zum primero al nivel que quiera usar y anotanto el valor de escala en la barra de estado de QGIS.
Controlar el renderizado del mapa
Map rendering can be controlled in various ways, as described below.
Suspender el renderizado
To suspend rendering, click the Render checkbox in the
lower right corner of the status bar. When the Render
checkbox is not checked, QGIS does not redraw the canvas in response to any of
the events described in section Renderizado. Examples of when you
might want to suspend rendering include:
Añadir muchas capas y simbolizarlas antes de dibujar
Añadir una o más capas grandes y establecer la dependencia de escala antes de dibujar
Añadir una o más capas grandes y hacer zoom a una vista específica antes de dibujar
Cualquier combinación de la anteriores
Marcar la casilla Renderizar habilita el renderizado y origina un refresco inmediato del lienzo del mapa.
Configurar la opción de añadir una capa
Puede establecer una opción para cargar siempre las nuevas capas sin dibujarlas. Esto significa que las capas se añadirán al mapa pero su casilla de visibilidad en el panel Capas no estará marcada de forma predeterminada. Para establecer esta opción, seleccione la opción de menú Configuración ‣ Opciones y haga clic en la pestaña Representación. Desmarque la casilla Por omisión, las nuevas capas añadidas al mapa se deben visualizar. Cualquier capa añadida posteriormente al mapa estará desactivada (invisible) por omisión.
Detener el renderizado
Para detener el dibujado del mapa, presione la tecla ESC. Esto detendrá el refresco del lienzo del mapa y dejará el mapa parcialmente dibujado. Puede que tarde un poco desde que se presiona la tecla ESC hasta que se detenga el dibujado del mapa.
Nota
Actualmente no es posible detener la representación — esto se desactivó en el paso a Qt4 debido a problemas y cuelgues de la Interfaz de Usuario (IU).
Influir en la calidad del renderizado
QGIS has an option to influence the rendering quality of the map. Choose menu
option Settings ‣ Options, click on the Rendering
tab and select or deselect Make lines appear less jagged
at the expense of some drawing performance.
Acelerar renderizado
There are some settings that allow you to improve rendering speed. Open the QGIS options dialog using Settings ‣ Options, go to the Rendering tab and select or deselect the following checkboxes:
- Usar cacheado de representación cuando sea posible para acelerar redibujados
- Render layers in parallel using many CPU cores and then
set the Max cores to use.
- The map renders in the background onto a separate image and each
Map Update interval, the content from this
(off-screen) image will be taken to update the visible screen representation.
However, if rendering finishes faster than this duration, it will be shown
instantaneously.
- With Enable Feature simplification by default for newly
added layers, you simplify features’ geometry (less nodes) and as a result,
they quickly display.
Be aware that you can also face rendering inconsistencies.
Selector de color
The select color dialog will appear whenever you push
the  icon to choose a color. The features of this dialog
depends on the state of the Use native color chooser dialogs parameter
checkbox in Settings ‣ Options ‣ General menu.
When checked, the color dialog used is the one of the OS being used. Otherwise,
QGIS custom color chooser is used.
icon to choose a color. The features of this dialog
depends on the state of the Use native color chooser dialogs parameter
checkbox in Settings ‣ Options ‣ General menu.
When checked, the color dialog used is the one of the OS being used. Otherwise,
QGIS custom color chooser is used.
This dialog has four different tabs which allow you to select colors by
 color ramp,
  color wheel,
 color swatches or
  color picker
(not available under
color picker
(not available under  ).
).
Whatever method you use, the selected color is always described through color sliders for HSV (Hue, Saturation, Value) and RGB (Red, Green, Blue) values. There is also an opacity slider to set transparency level. On the lower left part of the dialog you can see a comparison between the current and the new color you are presently selecting and on the lower right part you have the option to add the color you just tweaked into a color slot button.
Figure color selector 1:
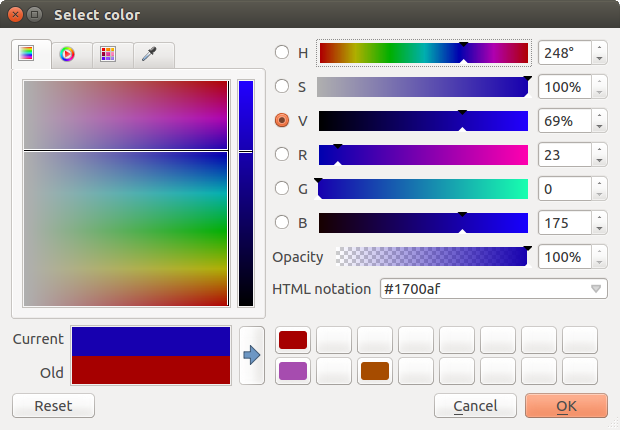
Color selector ramp tab
Truco
Dynamically change the color with the live-updating option
Check the Use live-updating color chooser dialogs option in the General Settings to have the color applied to your items as you change color parameters in the QGIS custom color chooser dialog.
With color ramp or with color wheel,
you can browse to all possible color combinations.
There are other possibilities though. By using color swatches
you can choose from a preselected list. This selected list is
populated with one of three methods:
- Recent colors,
- Standard colors, a user-defined list of colors set under Settings ‣ Options ‣ Colors menu
- or Project colors, a user-defined list of colors set under Project ‣ Project Properties ‣ Default Styles.
Figure color selector 2:
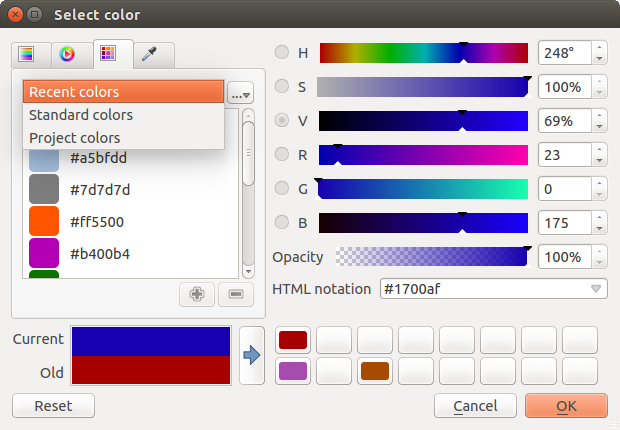
Color selector switcher tab
Another option is to use the color picker which allows
you to sample a color from under your mouse pointer at any part of
QGIS or even from another application by pressing the space bar. Please note
that the color picker is OS dependent and is currently not supported by OSX.
Truco
quick color picker + copy/paste colors
You can quickly choose from Recent colors, from Standard colors
or simply copy or paste a color by clicking
the drop-down arrow that follows the color box.
Figure color selector 3:
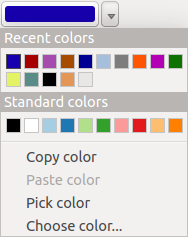
Menú seleccionador rápido de color
Modos de Mezcla
QGIS offers different options for special rendering effects with these tools that you may previously only know from graphics programs. Blending modes can be applied on layers, on features but also on print composer items:
- Normal: This is the standard blend mode, which uses the alpha channel of the top pixel to blend with the pixel beneath it. The colors aren’t mixed.
Iluminado: Este selecciona el máximo de cada componente del primer y segundo plano de píxeles. Tenga en cuenta que los resultados tienden a ser irregulares y rigurosos.
Pantalla: píxeles de luz de la fuente se pintan sobre el destino, mientras que los píxeles oscuros no lo son. Este modo es muy útil para la mezcla de la textura de una capa con otra (por ejemplo, puede utilizar un sombreado para texturizar otra capa).
Esquivar: aclarará y saturar píxeles subyacentes en base a la ligereza del punto de imagen superior. Así, los píxeles superiores más brillantes provocan la saturación y el brillo de los píxeles subyacentes a aumentar. Esto funciona mejor si los píxeles superiores no son demasiado brillantes; de lo contrario el efecto sera demasiado extremo.
- Addition: This blend mode simply adds pixel values of one item with the other. In case of values above one (in the case of RGB), white is displayed. This mode is suitable for highlighting features.
- Darken: This creates a resultant pixel that retains the smallest components of the foreground and background pixels. Like lighten, the results tend to be jagged and harsh.
- Multiply: Here, the numbers for each pixel of the top item are multiplied with the corresponding pixels for the bottom item. The results are darker pictures.
- Burn: Darker colors in the top item cause the underlying items to darken. Burn can be used to tweak and colorise underlying layers.
- Overlay: This mode combines the multiply and screen blending modes. In the resulting picture, light parts become lighter and dark parts become darker.
- Soft light: This is very similar to overlay, but instead of using multiply/screen it uses color burn/dodge. This is supposed to emulate shining a soft light onto an image.
- Hard light: Hard light is also very similar to the overlay mode. It’s supposed to emulate projecting a very intense light onto an image.
- Difference: Difference subtracts the top pixel from the bottom pixel, or the other way around, to always get a positive value. Blending with black produces no change, as the difference with all colors is zero.
- Subtract: This blend mode simply subtracts pixel values of one item from the other. In case of negative values, black is displayed.
Zooming and Panning
QGIS provides tools to zoom and pan to your area of interest.
Aparte de utilizar los iconos  Desplazar mapa y
  Acercar zum /
  Alejar zum en la barra de herramientas con el ratón, navergar también se puede hacer con la rueda del ratón, la barra espacidadora y las teclas de flecha.
Zooming and panning with the mouse wheel
Mientras se digitaliza, se puede presionar la rueda del ratón para desplazarse a través de la ventana principal, y se puede rodar la rueda del ratón para acercar el zum y alejar el zum en el mapa. Para hacer zum, coloque el cursor del ratón dentro del área del mapa y gire hacia adelante (hacia la derecha) para acercar y hacia atrás (hacia usted) para alejar la imagen. La posición del cursor del ratón será el centro de la zona de interés ampliada. Puede personalizar el comportamiento del zum con la rueda del ratón utilizando la pestaña Herramientas del mapa bajo el menú Configuración‣  Opciones.
Panning with the arrow keys
Panning the map is possible with the arrow keys. Place the mouse cursor inside the map area, and click on the right arrow key to pan east, left arrow key to pan west, up arrow key to pan north, and down arrow key to pan south.
You can also use the space bar to temporarily cause mouse movements to pan the map. The PgUp and PgDown keys on your keyboard will cause the map display to zoom in or out.
Mediciones
QGIS provides four means of measuring geometries:
- the interactive measurement tools
 ,
, - measuring in the
 Field Calculator,
 - derived measures in the Identificar objetos espaciales tool,
- and a vector analysis tool: Vector ‣ Geometry Tools ‣ Export/Add Geometry Columns
Measuring works within projected coordinate systems (e.g., UTM) and unprojected data. The first three measuring tools behave equally to global project settings:
If “on the fly” CRS transformation is enabled, the default measurement metric is - different from most other GIS - ellipsoidal, using the ellipsoid defined in File ‣ Project properties ‣ General. This is true both when geographic and projected coordinate systems are defined for the project. If you want to calculate the projected / planimetric area or distance using cartesian maths, the measurement ellipsoid has to be set to “None / Planimetric” (File ‣ Project properties ‣ CRS). However, with a geographic (= unprojected) CRS defined for the data and project, area and distance measurement will be ellipsoidal. If “on the fly” CRS transformation is disabled, the measurement metric is planimetric when the project coordinate system is projected and ellipsoidal when the project coordinate system is unprojected / geographic.
However, neither the identify tool nor the field calculator will transform your data to the project CRS before measuring. If you want to achieve this, you have to use the vector analysis tool: Vector ‣ Geometry Tools ‣ Export/Add Geometry Columns. Here, measurement is by default planimetric except if you choose the ellipsoidal measure.
Measure length, areas and angles interactive
All measuring modules use the snapping settings from the digitizing module. This is useful, if you want to measure along lines or areas in vector layers.
To select a measuring tool, click on and select the tool you want
to use.
By default, Measure Line: QGIS measures real distances
between given points according to a defined ellipsoid. You can define a rubberband
color and your preferred measurement units (meters or feet) and angle units
(degrees, radians and gon) in the menu option
Settings ‣ Options ‣ Map Tools.
The tool then allows you to click points on the map. Each segment length,
as well as the total, shows up in the measure window.
To stop measuring, click your right mouse button.
Note that you can interactively change the measurement units in the measurement
dialog. It overrides the Preferred measurement units in the options.
There is an info section in the dialog that shows which CRS settings are being
used during measurement calculations.
Figure Measure 1:
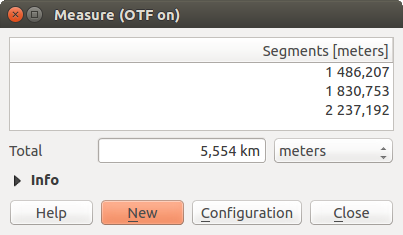
Medir Distancia
 Measure Area: Areas can also be measured. In the
measure window, the accumulated area size appears. In addition, the measuring
tool will snap to the currently selected layer, provided that layer has its
snapping tolerance set (see section Configurar la tolerancia del autoensamblado y radio de búsqueda). So, if you want
to measure exactly along a line feature, or around a polygon feature, first set
its snapping tolerance, then select the layer. Now, when using the measuring
tools, each mouse click (within the tolerance setting) will snap to that layer.
Measure Area: Areas can also be measured. In the
measure window, the accumulated area size appears. In addition, the measuring
tool will snap to the currently selected layer, provided that layer has its
snapping tolerance set (see section Configurar la tolerancia del autoensamblado y radio de búsqueda). So, if you want
to measure exactly along a line feature, or around a polygon feature, first set
its snapping tolerance, then select the layer. Now, when using the measuring
tools, each mouse click (within the tolerance setting) will snap to that layer.
Figure Measure 2:

Medir Área
 Medir ángulo: Se pueden también medir ángulos. El cursor se convierte en forma de cruz. Se debe hacer clic para dibujar el primer segmento del ángulo que se desea medir y a continuación mover el cursor para dibujar el ángulo deseado. La medida se mostrará en el diálogo emergente.
Figure Measure 3:
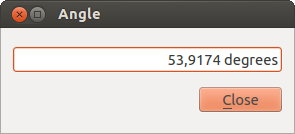
Medir Ángulo
Seleccionar y deseleccionar objetos espaciales
The QGIS toolbar provides several tools to select features in the map canvas.
To select one or several features, just click on  and select your
tool:
and select your
tool:
 Select Features by area or single click to
select feature(s) either by simple click or by rectangle
Select Features by area or single click to
select feature(s) either by simple click or by rectangle Select Features by Polygon
 Select Features by Freehand
 Select Features by Radius
To deselect all selected features, click on  Deselect
Features from All Layers.
Deselect
Features from All Layers.
 Select features using an expression allows user
to select features using expression dialog. See Expresiones
chapter for some example.
Select features using an expression allows user
to select features using expression dialog. See Expresiones
chapter for some example.
Users can save selected features into a New Memory Vector Layer or a New Vector Layer using Edit ‣ Copy Features and Edit ‣ Paste Features as in the wanted format.
Data defined override setup
Beside many options in the vector layer properties dialog or settings in the print
composer, you can find a  Data defined override icon.
Thanks to expressions based on layer attributes or item
settings, prebuild or custom functions and variables,
this tool allows you to set dynamic value for the concerned parameter. When enabled,
the value returned by this widget is applied to the parameter regardless its normal
value (checkbox, textbox, slider...).
Data defined override icon.
Thanks to expressions based on layer attributes or item
settings, prebuild or custom functions and variables,
this tool allows you to set dynamic value for the concerned parameter. When enabled,
the value returned by this widget is applied to the parameter regardless its normal
value (checkbox, textbox, slider...).
Clicking the Data defined override icon shows:
- a Description ... that indicates if it is enabled, which input expected, valid input type and the current definition,
- an entry to list the Field type available,
- an entry to list the Variable available,
- Edit ... button to create or edit the expression to use,
- Paste and Copy buttons,
- Clear button to remove the setup.
Truco
When the data-defined override option is setup correctly the
icon is yellow  or
or  ; if it is broken,
the icon is red
; if it is broken,
the icon is red  or
or  .
.
Parameters that can be used with data-defined tools are:
- Style and symbols parameters
Parámetros de Etiquetas
- Composer parameters
Identificar objetos espaciales
The Identify tool allows you to interact with the map canvas and get information
on features in a pop-up window. To identify features, use View ‣ Identify
features or press Ctrl + Shift + I, or click the  Identify features icon on the Attributes toolbar.
QGIS offers two ways to identify features with the
Identify features tool:
- left click will identify features according to the mode set in the Identify results panel
- right click will fetch all the snapped features from all the visible layers. This will open a context menu, allowing the user to choose more precisely the features to identify.
If you click on feature(s), the Identify results dialog will list information about the clicked feature(s). The default view is a tree view where the first item is the name of the layer and its children are its identified feature(s). Each feature is described by the name of a field along with its value. This field is the one set in Properties ‣ Display. Then follows all the other information about the feature.
Esta ventana puede ser personalizada para mostrar campos personalizados, pero por omisión mostrará tres tipos de información:
- Actions: Actions can be added to the identify feature windows. The action is run by clicking on the action label. By default, only one action is added, namely view feature form for editing. You can define more actions in the layer’s properties dialog.
- Derived: This information is calculated or derived from other information. This includes the feature id, its length or perimeter and area in map units depending on its geometry, the count of spatial parts and the number of the clicked part in case of multi-geometry, the count of vertices in the feature and the number of the closest one to the point clicked. It also reports the X and Y (and Z/M if available) coordinate values of both clicked point and feature closest vertex.
- Data attributes: This is the list of attribute fields and values for the feature that has been clicked.
Figure Identify 1:

Diálogo identificar objetos
At the top of the window, you have seven icons:
 Expand tree
 Collapse tree
 Default behavior to define whether next
identified features information should be collapsed or expanded
Default behavior to define whether next
identified features information should be collapsed or expanded View the feature form
- Clear Results
 Copy selected feature to clipboard
 Print selected HTML response
At the bottom of the window, you have the Mode and View comboboxes. With the Mode combobox you can define from which layers features should be identified:
- ‘Current layer’ : only features from the selected layer are identified. The layer may not be visible in the canvas.
- ‘Top down, stop at first’: for only features from the upper visible layer.
- ‘Top down’: for all features from the visible layers. The results are shown in the panel.
- and ‘Layer selection’: opens a context menu where the user selects the layer to identify features from. Operates like a right-click. Only the chosen features will be shown in the result panel.
The View can be set as ‘Tree’, ‘Table’ or ‘Graph’. ‘Table’ and ‘Graph’ views can only be set for raster layers.
The identify tool allows you to auto open a form.
If checked, each time a single feature is identified QGIS will open a form
showing its attributes. This is a handy way to quickly edit a feature’s attributes.
Otras funciones se pueden encontrar en el menú contextual del elemento identificado. Por ejemplo, del menú contextual se puede:
Ver el formulario del objeto espacial
Zum a objeto espacial
Copiar objeto espacial: Copiar toda la geometría y atributos del objeto espacial
- Toggle feature selection: Adds identified feature to selection
Copiar el valor del atributo: copiar solo el valor del atributo sobre el cual se hizo clic
Copiar atributos del objeto espacial: Copiar atributos del objeto espacial
Limpiar resultados: quitar resultados de la ventana
Limpiar resaltados: Deseleccionar los objetos espaciales en el mapa
Resaltar todo
Resaltar capa
Activar capa: Elegir una capa para ser activada
Propiedades de la capa: Abrir la ventana de propiedades de la capa.
Expandir todo
Colapsar todo
Herramientas de anotaciones
The  Text Annotation tool in the attribute
toolbar provides the possibility to place formatted text in a balloon on the
QGIS map canvas. Use the Text Annotation tool and click into the
map canvas.
Text Annotation tool in the attribute
toolbar provides the possibility to place formatted text in a balloon on the
QGIS map canvas. Use the Text Annotation tool and click into the
map canvas.
Figure annotation 1:

Diálogo de texto de anotación
Haciendo doble clic sobre el elemento se abre un cuadro de diálogo con varias opciones. Hay un editor de texto para escribir el texto con formato y otros ajustes de elementos. Por ejemplo, existe la opción de tener el elemento colocado en una posición del mapa (mostrado por el símbolo del marcador) o tener el elemento en una posición de la pantalla (no relacionado con el mapa). El elemento se puede mover por la posición del mapa (al arrastrar el marcador del mapa) o moviendo solo el globo. Los iconos son parte del tema de los SIG, y se utilizan de forma predeterminada en otros temas también.
The  Move Annotation tool allows you to move the
annotation on the map canvas.
Move Annotation tool allows you to move the
annotation on the map canvas.
Anotaciones HTML
The  Html Annotation tools in the attribute
toolbar provides the possibility to place the content of an html file in a
balloon on the QGIS map canvas. Using the Html Annotation tool,
click into the map canvas and add the path to the html file into the dialog.
Html Annotation tools in the attribute
toolbar provides the possibility to place the content of an html file in a
balloon on the QGIS map canvas. Using the Html Annotation tool,
click into the map canvas and add the path to the html file into the dialog.
Anotaciones SVG
The  SVG Annotation tool in the attribute toolbar
provides the possibility to place an SVG symbol in a balloon on the QGIS map
canvas. Using the SVG Annotation tool, click into the map canvas and
add the path to the SVG file into the dialog.
SVG Annotation tool in the attribute toolbar
provides the possibility to place an SVG symbol in a balloon on the QGIS map
canvas. Using the SVG Annotation tool, click into the map canvas and
add the path to the SVG file into the dialog.
Anotaciones de formulario
Additionally, you can also create your own annotation forms. The
Form Annotation tool is useful to display
attributes of a vector layer in a customized Qt Designer form (see
figure_custom_annotation). This is similar to the designer forms for the
Identify features tool, but displayed in an annotation item.
Also see this video https://youtu.be/0pDBuSbQ02o?t=2m25s from
Tim Sutton for more information.
Figure annotation 2:

Customized qt designer annotation form
Nota
Si presiona Ctrl+T mientras está activa una herramienta Anotación (mover anotación, anotación de texto, anotación de formulario), se invierten los estados de visibilidad de los elementos.
Marcadores espaciales
Spatial Bookmarks allow you to “bookmark” a geographic location and return to it later. Bookmarks are saved on the computer, meaning that they are available from any project in the same computer.
Crear un marcador
Para crear un marcador:
Hacer zoom o desplazarse al área de interés.
- Select the menu option View ‣ New Bookmark or press Ctrl-B. The Spatial Bookmark panel opens with the newly created bookmark.
Introduzca un nombre descriptivo para el marcador (hasta 255 caracteres).
- Press Enter to add the bookmark or click elsewhere.
Tenga en cuenta que puede tener múltiples marcadores con el mismo nombre.
Trabajar con marcadores
To use or manage bookmarks, select the menu option View ‣ Show Bookmarks. The Spatial Bookmarks panel allows you to:
- Zoom to a Bookmark: select the desired bookmark and then click Zoom To Bookmark. You can also zoom to a bookmark by double-clicking on it.
- Delete a Bookmark: select the bookmark and click Delete Bookmark. Confirm your choice.
- Import or Export a bookmark: To share or transfer your bookmarks between computers you can use the Import/Export Bookmarks pull down menu in the Spatial Bookmarks dialog. All the bookmarks are transferred.
Anidar proyectos
Si se quiere incluir contenido de otros proyectos en un proyecto, se puede elegir Capa ‣ Empotrar capas y grupos.
Empotrar capas
El siguiente cuadro de diálogo le permite incluir capas de otros proyectos. Aquí un pequeño ejemplo:
Presione
 para buscar otro proyecto del conjunto de datos de Alaska.
Seleccionar el archivo de proyecto relations.qgs. Puede ver el contenido del proyecto (ver figure_embed_dialog).
- Press Ctrl and click on the layers airports and regions. Press [OK]. The selected layers are embedded in the map legend and the map view now.
Figure Nesting 1:
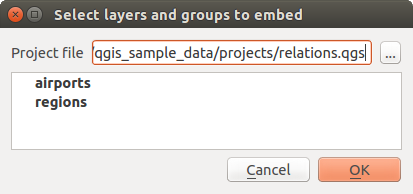
Seleccionar capas y grupos para empotrar
Si bien las capas incrustadas son editables, no se pueden cambiar sus propiedades como estilo y etiquetado.
Eliminar capas incrustadas
Clic derecho en la capa empotrada y elegir  Eliminar.
Elementos decorativos
Las Ilustraciones de QGIS incluyen la Cuadrícula, Etiqueta de Copyright, Flecha de Norte y Barra de Escala. Se usan para ‘adornar’ el mapa al agregar elementos cartográficos
Cuadrícula
 Cuadrícula permite agregar una rejilla de coordenadas y anotaciones a la vista del mapa.
Figure Decorations 1:
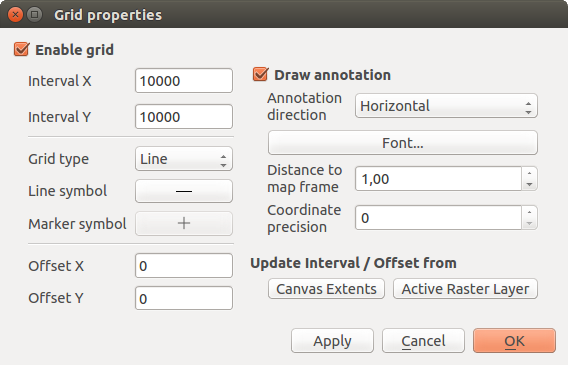
El Diálogo Cuadrícula
Seleccione en el menú Ver ‣ Ilustraciones‣ Cuadrícula. Aparece el díálogo (ver figure_decorations_1).
Activar la casilla
Activar cuadrícula y establecer la definición de la cuadrícula de acuerdo con las capas cargadas en la vista del mapa.Activar la casilla
Dibujar anotaciones y establecer la definición de las anotaciones de acuerdo con las capas cargadas en la vista del mapa.- Click [Apply] to verify that it looks as expected or [OK] if you’re satisfied.
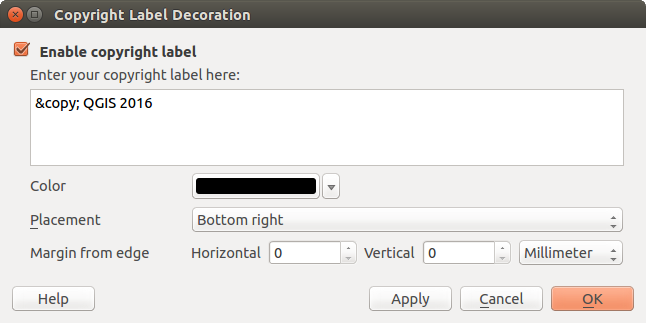
Etiqueta de derechos de autor
 Copyright label adds a copyright label using the text
you prefer to the map.
Copyright label adds a copyright label using the text
you prefer to the map.
Figure Decorations 2:
El Diálogo de Derechos de Autor
Seleccione en el menú Ver ‣ Ilustraciones‣ Etiqueta de Copyright. Aparece el díálogo (ver figure_decorations_2).
Comprobar que la casilla de verificación
Activar etiqueta de copyright este marcada.Escribir el texto que se quiera colocar en el mapa. Se puede usar HTML como se muestra en el ejemplo.
Elegir la ubicación de la etiqueta en la lista desplegable Ubicación

- You can refine the placement of the item by setting a Horizontal and/or Vertical Marging from (Canvas) Edge. These values can be a distance in Millimeter or Pixels or set as Percentage of the width or height of the map canvas.
- You can change the color to apply.
- Click [Apply] to verify that it looks as expected or [OK] if you’re satisfied.
In the example above, which is the default, QGIS places a copyright symbol followed by the date in the lower right-hand corner of the map canvas.
Flecha del Norte
![]() North Arrow places a simple north arrow on the map canvas.
Currently, there is only one style available. You can adjust the angle of the
arrow or let QGIS set the direction automatically.
If you choose to let QGIS determine the direction, it makes its best guess
as to how the arrow should be oriented.
For placement of the arrow, you have four options, corresponding to
the four corners of the map canvas.
You can refine the placement of the arrow by setting a Horizontal and/or Vertical
Marging from (Canvas) Edge. These values can be a distance in Millimeter or
Pixels or set as Percentage of the width or height of the map canvas.
North Arrow places a simple north arrow on the map canvas.
Currently, there is only one style available. You can adjust the angle of the
arrow or let QGIS set the direction automatically.
If you choose to let QGIS determine the direction, it makes its best guess
as to how the arrow should be oriented.
For placement of the arrow, you have four options, corresponding to
the four corners of the map canvas.
You can refine the placement of the arrow by setting a Horizontal and/or Vertical
Marging from (Canvas) Edge. These values can be a distance in Millimeter or
Pixels or set as Percentage of the width or height of the map canvas.
Figure Decorations 3:
El Diálogo Flecha Norte
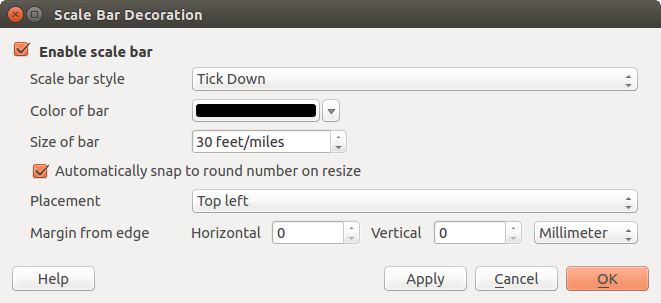
Barra de escala
 Scale Bar adds a simple scale bar to the map canvas. You
can control the style and placement, as well as the labelling of the bar.
Scale Bar adds a simple scale bar to the map canvas. You
can control the style and placement, as well as the labelling of the bar.
Figure Decorations 4:
El Diálogo Barra de Escala
QGIS only supports displaying the scale in the same units as your map frame. So if the units of your layers are in meters, you can’t create a scale bar in feet. Likewise, if you are using decimal degrees, you can’t create a scale bar to display distance in meters.
Para añadir una barra de escala:
Seleccionar del menú Ver ‣ Ilustraciones ‣ Barra de escala. Se iniciará el diálogo (ver figure_decorations_4).
Comprobar que la casilla de verificación
Habilitar barra de escala esté marcada.Elegir el estilo de la caja desplegable Estilo de la barra de escala
- Select the color for the bar Color of bar or use
the default black color.
- Set the Size of bar
 .
. - Optionally, check Automatically snap to round number
on resize to display values easy-to-read.
Elegir la ubicación de la lista desplegable Ubicación
.- You can refine the placement of the item by setting a Horizontal and/or Vertical Marging from (Canvas) Edge. These values can be a distance in Millimeter or Pixels or set as Percentage of the width or height of the map canvas.
- Click [Apply] to verify that it looks as expected or [OK] if you’re satisfied.
Truco
Configuración de elementos decorativos
Al guardar un proyecto .qgs, cualquiera de los cambios que se hayan hecho a la cuadrícula, flecha de norte, barra de escala y copyright se guardarán en el proyecto y se restaurán la próxima vez que cargue el proyecto.
Autenticación
QGIS has facility to store/retrieve authentication credentials in a secure manner. Users can securely save credentials into authentication configurations, which are stored in a portable database, can be applied to server or database connections, and safely referenced by their ID tokens in project or settings files. For more information see Sistema de autenticación.
A master password needs to be set up when initializing the authentication system and its portable database.
Guardar capa en archivo
Layers (raster or vector) can be saved in another format with the Save As... feature in the layer contextual menu (by right-clicking in the layer in the layer tree) or in the Layer ‣ Save As... menu.
The Save As dialog shows several parameters to change the behaviour when saving the layer. Common parameters (raster and vector) are:
Formato
Nombre de archivo
SRC
- Add save file to map to add the new layer to the canvas
- Extent (possible values are layer, Map view or custom extent)
- Create (for raster), Layer or Custom (for vector) Options which allow you to change some advanced options. Advanced user can see the driver documentation in gdal-ogr documentation.
However, some parameters are specific to raster and vector formats:
- Raster specific parameters:
Resolución (Horizontal and vertical)
Creación de pirámide
- Output mode (raw data or rendered image)
- Vector specific parameters:
Codificación
Guardar solo elementos seleccionados
Saltar la creación de atributos
- Symbology export: can be used mainly for DXF export and for all file
formats who manage OGR feature styles (see note below) as DXF, KML, tab
file formats:
- No symbology: default style of the application that reads the data
- Feature symbology: save style with OGR Feature Styles (see note below)
- Symbol Layer symbology: save with OGR Feature Styles (see note below) but export the same geometry multiple times if there are multiple symbology symbol layers used
- Geometry:
- force to multi-geometry,
Añadir dimensión Z
- add or remove a geometry column with the drop-down list. This is not linked with the current geometry type of the layer. You can add an empty geometry column to an attribute table, remove the geometry column of a spatial layer.
Nota
OGR Feature Styles are a way to store style directly in the data as a hidden attribute. Only some format can handle this kind of information. KML, DXF and TAB files format are such format. For advanced user, you can read the OGR Feature Styles specification document.
Nota
Sobre Archivos DXF
Vector layers can be exported to DXF files using another tool, the DXF Export ... in Project. The windows allow the user to choose the layer file, the symbology mode (see the note above), the symbology scale, the encoding, the visibility preset and the layers to include in the DXF file.
As an option, you can Use the layer title as name if
set or Export features intersecting the current map extent.
Use of variables for dynamic content
You can define custom variables for use in expressions. Variables can be defined at the application global level, project level, layer level and composition level. Just like CSS cascading rules, variables can be overwritten - eg, a project level variable will overwrite any application level variables set. You can use these variables to build text strings or other custom expressions using @ character before the variable name. For example in composer creating a label with this content:
This map was made using QGIS [% @qgis_version %]. The project file for this
map is: [% @project_path %]
Will render the label like this:
This map was made using QGIS 2.14. The project file for this map is:
/gis/qgis-user-conference-2015.qgs
You can manage global variables from the Settings ‣ Options menu, and project level variables from Project properties (including adding your own custom variables).
Figure Variables dialog 2:

Edit variable at the project level
Nota
you can read more information and find examples here Exploring variables in QGIS 2.12, part 1, part 2 and part 3.