Strumenti generali
Informazione elementi
Lo strumento Informazioni elementi permette di interagire con la mappa per ottenere gli attributi delle geometrie in finestre di dialogo. Attivare lo strumento tramite Visualizza ‣ Informazione elementi oppure con Ctrl+Shift+I oppure ancora cliccando sull’icona Informazione elementi nella barra degli strumenti.
Se si clicca su più geometrie, la finestra elencherà tutti gli attributi di tutte le geometrie. Il primo elemento nella lista fa riferimento all’ordine dell’elemento cliccato, seguito dal nome del vettore. Gli altri elementi della lista faranno riferimento ai vari campi con i rispettivi valori. Infine, vengono fornite informazioni sulla geometria stessa.
Questa finestra può essere personalizzata in modo da visualizzare determinati campi, ma in modo predefinito mostra tre tipi di informazione:
Azioni: si possono aggiungere le azioni nella lista degli elementi. Sarà sufficiente cliccare sull’etichetta azione per eseguire l’azione. In modo predefinito è presente solamente l’azione che apre il modulo degli attributi per la successiva modifica.
Derivato: queste informazioni sono calcolate o derivano da altre informazioni. Verranno visualizzate le coordinate X e Y cliccate, l’area e il perimetro in unità di mappa e l’ID della geometria.
- Data attributes: this is the list of attribute fields from data.
Figure Identify 1:
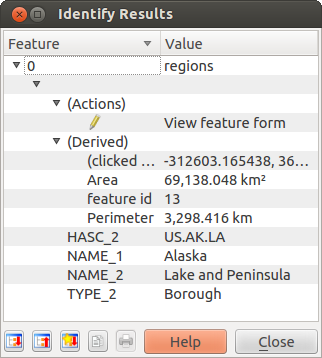
Finestra di dialogo Informazioni elementi  (Gnome)
In fondo alla finestra ci sono cinque icone:
 Espandi albero
 Racchiudi albero
 Impostazione predefinita
 Copia attributi
 Stampa il responso HTML selezionato
È possibile accedere a molte altre funzioni cliccando con il tasto destro direttamente sulla lista degli elementi.
This menu allows to:
Visualizza modulo geometria
Zoom alla geometria
- Copy feature: copy all feature ie geometry and attributes;
Copia il valore attributo: copia solamente il valore dell’attributo scelto.
Copia attributi geometria: copia solamente gli attributi;
Cancella risultati: vengono rimossi i risultato nella finestra
Cancella evidenziati: verranno rimosse le geometrie evidenziate sulla mappa
Evidenzia tutto
Evidenzia vettore
- Layer properties: open layer properties window
Espandi tutto
Racchiudi tutto
Scorciatoie da tastiera
QGIS provides default keyboard shortcuts for many features. You find them in Section Barra dei Menu. Additionally the menu option Settings ‣ Configure Shortcuts allows to change the default keyboard shortcuts and to add new keyboard shortcuts to QGIS features.
Figure Shortcuts 1:
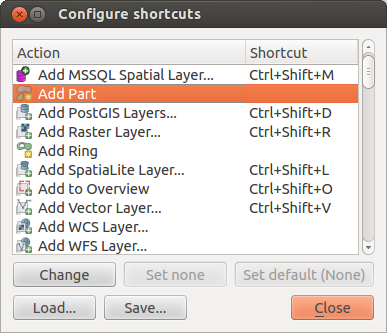
Finestra scorciatoie (Gnome)
Configuration is very simple. Just select a feature from the list and click on [Change], [Set none] or [Set default]. Once you have found your configuration, you can save it as XML file and load it to another QGIS installation.
Guide contestuali
Quando si ha necessità di maggiori informazioni su una funzionalità specifica è possibile utilizzare la guida contestuale tramite il bottone guilabel:Guida disponibile in molte finestre di dialogo. Si noti che nel caso di plugin di terze parti la guida contestuale potrebbe rimandare ad una pagina web dedicata.
Visualizzazione
By default, QGIS renders all visible layers whenever the map canvas must be refreshed. The events that trigger a refresh of the map canvas include:
Aggiunta di un layer
Spostamento, ingrandimento o riduzione (pan e zoom)
- Resizing the QGIS window
Cambiamento della visibilità di uno o più layer
QGIS allows you to control the rendering process in a number of ways.
Visualizzazione in funzione della scala
La visualizzazione in funzione della scala permette di specificare la scala minima e massima alla quale il vettore verrà visualizzato. Per impostare questa funzionalità, apri la finestra Proprietà facendo doppio click sul vettore. Nella scheda Generale, clicca sulla casella di controllo  Visualizzazione dipendente dalla scala: potrai cosi inserire i valori minimi e massimi di visualizzazione.
You can determine the scale values by first zooming to the level you want to use and noting the scale value in the QGIS status bar.
Controllare la visualizzazione della mappa
La visualizzazione della mappa può essere controllata nei seguenti modi:
Sospensione della visualizzazione
To suspend rendering, click the Render checkbox in the
lower right corner of the statusbar. When the Render
checkbox is not checked, QGIS does not redraw the canvas in response to any of
the events described in Section Visualizzazione. Examples of when you
might want to suspend rendering include:
Aggiunta di molti layer ed applicazione di uno stile visuale prima della visualizzazione
Aggiunta di uno o più layer di grosse dimensioni e impostazione di una scala prima della visualizzazione
Aggiunta di uno o più layer di grossa dimensione e zoom ad un’area specifica prima della visualizzazione
Combinazioni delle precedenti
La selezione della casella di controllo Aggiorna abilita la visualizzazione e causa l’immediato aggiornamento della vista mappa.
Controllare la visibilità dei layer quando sono caricati
You can set an option to always load new layers without drawing them. This
means the layer will be added to the map, but its visibility checkbox in the
legend will be unchecked by default. To set this option, choose
menu option Settings ‣ Options ‣ and click on the
Rendering menu. Uncheck the By default new layers
added to the map should be displayed checkbox. Any layer added to the map will
be off (invisible) by default.
Another option in Settings ‣ Options ‣ Rendering
menu is the Enable back buffer checkbox. It provides better
graphics performance at the cost of loosing the possibility to cancel rendering and
incremental feature drawing. If it is unchecked, you can set the ‘Number of features
to draw before updating the display’, otherwise it is inactive.
Finally you can activate the Use render caching where possible
to speed up redraws checkbox.
Fermare la visualizzazione
Per fermare la visualizzazione della mappa premere il tasto ESC. Si bloccherà cosi l`aggiornamento della vista e la mappa rimarrà parzialmente disegnata. Dopo aver premuto il tasto ESC potrebbe passare un po` di tempo affinchè l`interruzione della visualizzazione della mappa sia effettiva.
Nota
Al momento non è possibile interrompere la visualizzazione in corso: questa opzione è stata disabilitata nella porta qt4 a causa di diversi problemi dell`interfaccia utente (UI).
Aggiornamento della mappa durante la visualizzazione
You can set an option to update the map display as features are drawn. By default, QGIS does not display any features for a layer until the entire layer has been rendered. To update the display as features are read from the datastore, choose menu option Settings ‣ Options click on the Rendering menu. Set the feature count to an appropriate value to update the display during rendering. Setting a value of 0 disables update during drawing (this is the default). Setting a value too low will result in poor performance as the map canvas is continually updated during the reading of the features. A suggested value to start with is 500.
Modificare la qualità della visualizzazione
To influence the rendering quality of the map you have 2 options. Choose menu option Settings ‣ Options click on the Rendering menu and select or deselect following checkboxes.
- Rendi le linee meno irregolari a spese delle prestazioni
- Risolvi problemi con i poligoni riempiti non correttamente
Misurazioni
È possibile effettuare misure unicamente nei sistemi di coordinate piane (es. UTM). Se la mappa caricata è definita in un sistema di coordinate geografiche (es. latitudine/longitudine), il risultato della misura di linee o di aree sarà errato. Per misurare è quindi necessario impostare correttamente il sistema di coordinate della mappa (si veda la Sezione Lavorare con le proiezioni). Tutti i moduli di misura usano inoltre le opzioni di snapping del modulo di digitalizzazione. Questo è utile se si desidera misurare lungo linee o aree di layer vettoriali.
Per selezionare uno strumento di misura cliccare su  e scegliere lo strumento che si intende utilizzare.
Misurare lunghezze, aree ed angoli
Measure Line: QGIS is able to measure real distances between given points
according to a defined ellipsoid. To configure this, choose menu option
Settings ‣ Options, click on the Map tools tab and
choose the appropriate ellipsoid. There you can also define a rubberband color
and your preferred measurement units (meters or feet) and angle units (degrees,
radians and gon). The tools then allows you to click points on the map. Each
segment-length as well as the total shows up in the measure-window. To stop
measuring click your right mouse button.
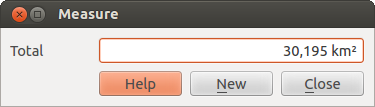
Figure Measure 1:
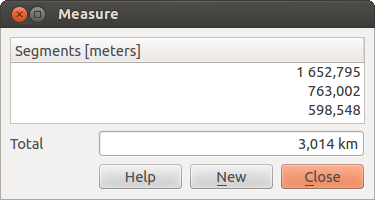
Misura distanze (Gnome)
 Measure Area: Areas can also be measured. In the measure window the
accumulated area size appears. In addition, the measuring tool will snap to the
currently selected layer, provided that layer has its snapping tolerance set.
(See Section Settare la tolleranza dello snapping e il raggio di ricerca degli elementi). So if you want to measure exactly along
a line feature, or around a polygon feature, first set its snapping tolerance,
then select the layer. Now, when using the measuring tools, each mouse click
(within the tolerance setting) will snap to that layer.
Measure Area: Areas can also be measured. In the measure window the
accumulated area size appears. In addition, the measuring tool will snap to the
currently selected layer, provided that layer has its snapping tolerance set.
(See Section Settare la tolleranza dello snapping e il raggio di ricerca degli elementi). So if you want to measure exactly along
a line feature, or around a polygon feature, first set its snapping tolerance,
then select the layer. Now, when using the measuring tools, each mouse click
(within the tolerance setting) will snap to that layer.
Figure Measure 2:
Misura area (Gnome)
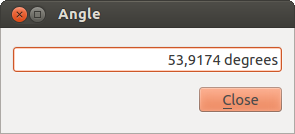
 Measure Angle: You can also measure angles. The cursor
becomes cross-shaped. Click to draw the first segment of the angle you
wish to measure, then move the the cursor to draw the desired angle. The measure
is displayed in a popup dialog.
Measure Angle: You can also measure angles. The cursor
becomes cross-shaped. Click to draw the first segment of the angle you
wish to measure, then move the the cursor to draw the desired angle. The measure
is displayed in a popup dialog.
Figure Measure 3:
Misura angolo (Gnome)
Selezionare e deselezionare elementi
The QGIS toolbar provides several tools to select features in the map canvas.
To select one or several features just click on
 and select your tool:
- Select Single Feature
 Select Features by Rectangle
 Select Features by Polygon
 Select Features by Freehand
 Select Features by Radius
Per deselezionare tutti gli elementi selezionati cliccare su  Deselect features from all layers.
Decorazioni
The Decorations of QGIS includes the Grid, Copyright Label, the North Arrow and the Scale Bar. They are used to ‘decorate’ the map by adding cartographic elements.
Grid
 Grid allows to add a coordinate grid and
coordinate annotations to the map canvas.
Grid allows to add a coordinate grid and
coordinate annotations to the map canvas.
Figure Decorations 1:
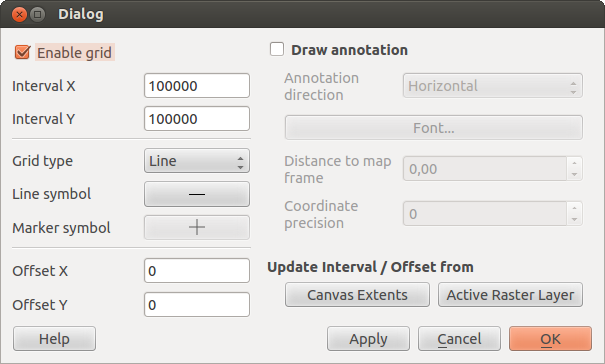
The Grid Dialog
- Select from menu View ‣ Decorations ‣ Grid. The dialog starts (see figure_decorations_1).
- Activate the Enable grid checkbox and set grid
definitions according to the layers loaded in the map canvas.
- Activate the Draw annotations checkbox and set
annotation definitions according to the layers loaded in the map canvas.
- Click [Apply] to check, if it looks as expected.
- Click [OK] to close the dialog.
Etichetta Copyright
 Copyright label adds a Copyright label
using the text you prefer to the map.
Copyright label adds a Copyright label
using the text you prefer to the map.
Figure Decorations 2:
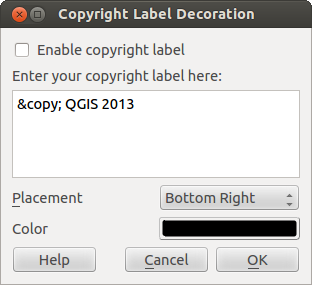
La finestra Copyright
- Select from menu View ‣ Decorations ‣ Copyright Label. The dialog starts (see figure_decorations_2).
Digitare il testo che si vuole aggiungere alla mappa. Si può usare codice HTML come mostrato nell’esempio
Scegliere il posizionamento dell’etichetta dal menu a tendina Posizione In basso a destra
Assicurasi che la casella di controllo
Abilita etichetta di Copyright sia selezionataCliccare [OK]
In the example above (default) QGIS places a copyright symbol followed by the date in the lower right hand corner of the map canvas.
Freccia Nord
![]() North Arrow places a simple north arrow on the
map canvas. At present there is only one style available. You can adjust the
angle of the arrow or let QGIS set the direction automatically. If you choose
to let QGIS determine the direction, it makes its best guess as to how the
arrow should be oriented. For placement of the arrow you have four options,
corresponding to the four corners of the map canvas.
North Arrow places a simple north arrow on the
map canvas. At present there is only one style available. You can adjust the
angle of the arrow or let QGIS set the direction automatically. If you choose
to let QGIS determine the direction, it makes its best guess as to how the
arrow should be oriented. For placement of the arrow you have four options,
corresponding to the four corners of the map canvas.
Figure Decorations 3:
La finestra Freccia Nord
Barra di Scala
 Scale Bar adds a simple scale bar to the map
canvas. You control the style and placement, as well as the labeling of the bar.
Scale Bar adds a simple scale bar to the map
canvas. You control the style and placement, as well as the labeling of the bar.
Figure Decorations 4:
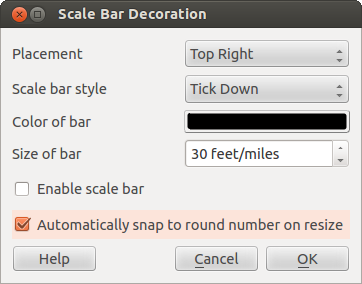
La finestra Barra di Scala
QGIS only supports displaying the scale in the same units as your map frame. So if the units of your layers are in meters, you can’t create a scale bar in feet. Likewise if you are using decimal degrees, you can’t create a scale bar to display distance in meters.
Per aggiungere una barra di scala:
- Select from menu View ‣ Decorations ‣ Scale Bar The dialog starts (see figure_decorations_4)
Scegliere il posizionamento dal menu a tendina Posizionamento In basso a sinistra
Scegliere lo stile dalla lista Stile della Barra di Scala Porta in basso
Scegliere il colore della barra di scala Colore della barra black o usare il colore nero di default
Impostare la dimensione della barra e la sua etichetta Dimensione della barra 30 gradi
Assicurarsi che la casella di controllo
Abilitare barra di scala sia selezionataSe si vuole, scegliere di arrotondare automaticamente il numero quando la mappa viene ridimensionata
Arrotonda automaticamente il numero durante il ridimensionamentoCliccare [OK]
Suggerimento
Impostazioni delle decorazioni
When you save a .qgs project, any changes you have made to Grid, NorthArrow, ScaleBar and Copyright will be saved in the project and restored the next time you load the project.
Note testuali
The  Text Annotation tools in the attribute toolbar
provides the possibility to place formatted text in a balloon on the QGIS map
canvas. Use the Text Annotation tool and click into the map canvas.
Text Annotation tools in the attribute toolbar
provides the possibility to place formatted text in a balloon on the QGIS map
canvas. Use the Text Annotation tool and click into the map canvas.
Figure annotation 1:
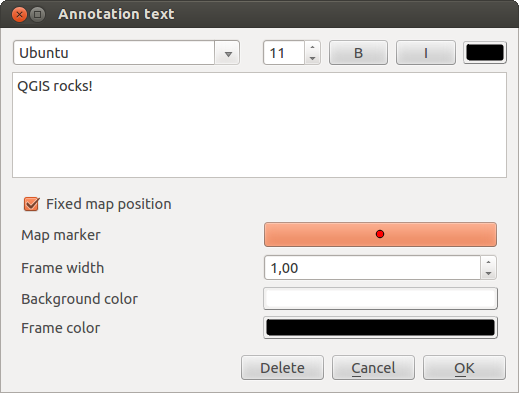
La finestra di annotazione testuale
Facendo doppio-click sull’elemento aggiunto sulla mappa dallo strumento note si ha accesso ad una finestra di dialogo con varie opzioni. C’è un editor di testo semplificato per l’inserimento del testo formattato; è possibile scegliere se vincolare il testo alla mappa o solo allo schermo.
The  Move Annotation tool allows to move the annotation on the
map canvas.
Move Annotation tool allows to move the annotation on the
map canvas.
Html annotations
The  Html Annotation tools in the attribute toolbar
provides the possibility to place the content of a html file in a balloon on the
QGIS map canvas. Use the Html Annotation tool, click into the map
canvas and add the path to the html file into the dialog.
Html Annotation tools in the attribute toolbar
provides the possibility to place the content of a html file in a balloon on the
QGIS map canvas. Use the Html Annotation tool, click into the map
canvas and add the path to the html file into the dialog.
SVG annotations
The  SVG Annotation tools in the attribute toolbar
provides the possibility to place a SVG Symbol in a balloon on the QGIS map canvas.
Use the SVG Annotation tool, click into the map canvas and add the
path to the SVG file into the dialog.
SVG Annotation tools in the attribute toolbar
provides the possibility to place a SVG Symbol in a balloon on the QGIS map canvas.
Use the SVG Annotation tool, click into the map canvas and add the
path to the SVG file into the dialog.
Modulo di annotazioni
Additionally you can also create your own annotation forms. The
Form Annotation tool is useful to display attributes of
a vector layer in a customized qt designer form (see figure_custom_annotation). It is similar to the
designer forms for the
Identify features tool, but displayed in an annotation item.
Also see QGIS blog http://blog.qgis.org/node/143 for more information.
Figure annotation 2:
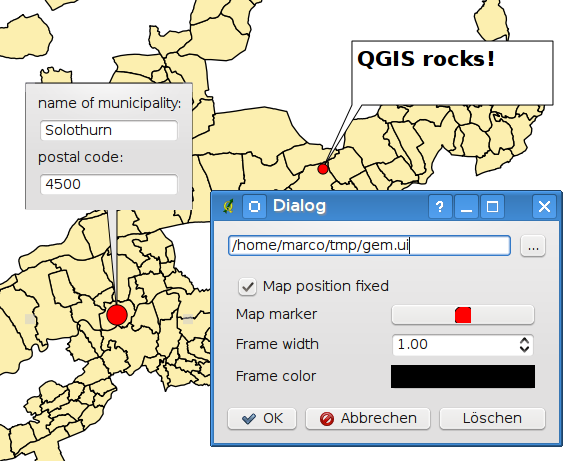
Modulo personalizzato qt designer di annotazioni
Nota
Nota: Premendo Ctrl+T con uno strumento nota attivo (Nota testuale, Nota con modulo, Muovi nota) lo stato di visualizzazione delle note si inverte: se sono visibili diventano invisibili e viceversa.
Segnalibri geospaziali
I segnalibri geospaziali consentono di memorizzare una posizione geografica alla quale ritornare in un secondo momento.
Creazione di un segnalibro
Per creare un segnalibro:
Usare lo zoom o muovere la mappa all’estensione d’interesse.
Selezionare la voce di menu Visualizza‣ Nuovo segnalibro‣ oppure premere Ctrl-B.
Inserire un nome descrittivo per il segnalibro (fino a 255 caratteri).
Cliccare su [OK] per aggiungere il segnalibro o [Close] per uscire senza aggiungere il segnalibro.
Si noti che è possibile avere più di un segnalibro con lo stesso nome.
Uso e gestione dei segnalibri
Per usare o gestire i segnalibri, selezionare la voce di menu Visualizza‣ Mostra segnalibri ‣. La finestra Segnalibri geospaziali consente di usare lo zoom a un segnalibro o di eliminarne uno. Non è possibile editare il nome o le coordinate di un segnalibro.
Zoom a un segnalibro
Dalla finestra Segnalibri geospaziali, selezionare il segnalibro desiderato cliccando su di esso, quindi cliccare su [Zoom A]. Si può usare lo zoom su un segnalibro anche facendo doppio click su di esso.
Cancellare un segnalibro
Per cancellare un segnalibro dalla finestra Segnalibri geospaziali, cliccare su di esso e poi sul pulsante [Elimina]. Confermare la scelta cliccando su [OK] o annullare l’eliminazione cliccando su [Close].
Progetti nidificati
Per includere file di progetti diversi all`interno del proprio progetto, scegliere Layer ‣ Includi layer e gruppi ‣.
Layers inclusi
La finestra di dialogo permette di scegliere quali layer di altri progetti includere:
Scegliere
 per cercare un altro progetto del dataset Alaska.
Selezionare il file progetto grassland. E` possibile vedere il contenuto del progetto (Figura figure_embed_dialog).
Premere Ctrl e cliccare sui layer grassland e regioni. I layers sono aggiunti sia nella legenda che nella vista della mappa.
Figure Nesting 1:
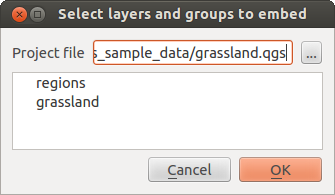
Selezione dei layer e dei gruppi da inserire
Non si possono modificare le proprietà, come stile e etichette, dei layers aggiunti.
Eliminare i layers inseriti
Right-click on the embedded layer and choose  Remove.
Aggiungi layer testo delimitato
This function allows you to load a delimited text file as a layer in QGIS. Following settings need to be defined:
- The File format usually is
 CSV (comma separated values). If another delimiter is used, activate the custom delimiter radiobutton and if each line in the file is split using a regular expression, please activate the Regular expression delimiter radiobutton.
 - As Record options a text file usually provides a delimited header row of field names. This is usually the first line in the text file. If there is no header row available, deactivate the first records have field names checkbox. And if the header row isn’t the first line of the text file, define the number of header lines to discard.
- As Field options you can trim leading and trailing spaces from fields activating the Trim fields checkbox. You can Discard empty fields in each record and you can define that the Decimal separator is comma. Otherwise it will be point.
- As Geometry definitions a typical text file provides Point coordinates. This means there must be an ‘X’ and ‘Y’ field with coordinate values. If the text file provides a Well Known Text field, there must be a ‘WKT’ field with geometry information for point, line or polygon objects. These fields can have any name. Otherwise for attribute tables define no geometry. The x and y coordinates must be specified as a number. The coordinate system is not important. If they are defined in degree/minutes/seconds, activate the DMS coordinates checkbox.
- As Layer settings you can activate Use spatial index to improve performance of displaying and spatially selecting features. You can define to Use Subset index and to Watch file to watch for changes to the file by other applications, while QGIS is running.
As an example of a valid text file we import the elevation point data file elevp.csv coming with the QGIS sample dataset (See Section Dati campione):
X;Y;ELEV
-300120;7689960;13
-654360;7562040;52
1640;7512840;3
[...]
Alcune note circa il file di testo:
Il file di testo usato come esempio usa ; (punto e virgola) come delimitatore. Qualsiasi carattere può essere usato per delimitare i campi.
La prima riga è la riga intestazione. Essa contiene i campi X, Y e ELEV.
Nessun tipo di virgoletta (") dev’essere usata per delimitare i campi di testo.
Le coordinate x sono contenuto nel campo X.
Le coordinate y sono contenuto nel campo Y.
Utilizzo della funzione
Clicca sull’icona  Aggiungi layer testo delimitato nella barra Gestione layer per aprire la finestra Crea un layer da un testo delimitato come mostrato in
Figure Delimited Text 1:
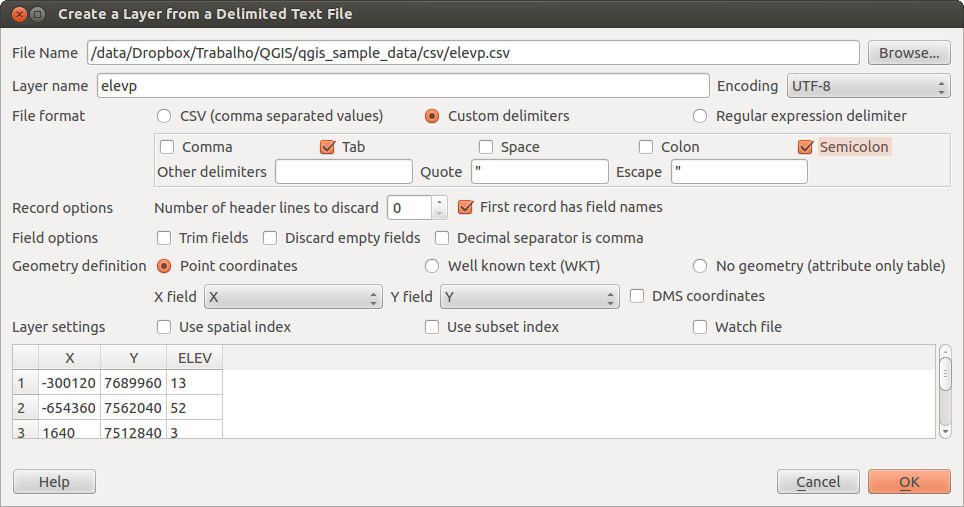
Finestra di dialogo Testo Delimitato
Selezionare il file (esempio qgis_sample_data/csv/elevp.csv) da importare cliccando su [Sfoglia]. Una volta caricato il file, QGIS cerca di processarlo usando l’ultimo delimitatore utilizzato, in questo caso un punto e virgola (;). È fondamentale selezionare il giusto delimitatore. Per cambiare delimitatore usare \t (questa è un’espressione per il carattere tab).
Once the file is parsed, make a Geometry definition Point coordinates
and choose the X and Y fields from the dropdown lists. Finally enter a Layer name (e.g., elevp)
as shown in figure_delimited_text_1 . To add the layer to the map, click [OK]. The delimited text file now behaves as
any other map layer in QGIS.