一般ツール
コンテキストヘルプ
特定のトピックでヘルプが必要な場合は多くのダイアログで利用できるようになっている Help ボタンを利用してこのユーザマニュアルの対応するページにアクセスできます --- サードパーティのプラグインは専用のWebページを指す可能性があることに注意してください。
パネル
QGISはデフォルトで多くのパネルを利用することができます。いくつかのパネルは以下に解説がありますが、文書の別の場所に説明があるものもあります。QGISのデフォルトパネルの完全なリストは の パネル で参照できます。
レイヤーパネル
レイヤーパネル (「地図凡例」とも呼ばれます)には、プロジェクト内のすべてのレイヤーが一覧表示され、それらの可視性の管理に役立ちます。 Ctrl+1 を押すと、表示または非表示にできます。レイヤーを選択して凡例内で上下にドラッグすると、Z順序を変更できます。 Z順序とは、凡例の上部にリストされているレイヤーが、凡例の下部にリストされているレイヤーの上に描画されることを意味します。
注釈
Z-順序の動作は レイヤーの順序 パネルによって上書きできます。
レイヤーパネルの上部で、ツールバーによって以下が可能です:
 レイヤのスタイルパネルを開く (F7): レイヤスタイルパネルの表示、非表示を切り替えます。
 新しいグループを追加 します。
 Manage Map Themes: 異なるマップテーマ内でのレイヤの可視設定と管理。
 地図内容で凡例をフィルタ :目に見える設定がされていて、地物が現在の地図キャンバスに交差するレイヤーだけが、レイヤーパネルで自分のスタイルをレンダリングされます。それ以外の場合は、一般的なNULL記号がレイヤーに適用されます。レイヤーシンボルに基づいて、これはレイヤーが関心のお住まいの地域をカバーしているから、地物のどの種類を識別するための便利な方法です。
 式による凡例のフィルタ:式を適用して、選択したレイヤツリーから、条件を満たす地物がないスタイルを削除します。これは、別のレイヤの特定の領域/地物内にある地物を強調表示するために使用できます。ドロップダウンリストから、現在適用されている式を編集およびクリアできます。
レイヤーパネル中のレイヤーとグループを
 すべて展開 したり
  すべて折りたたみ ます。
 削除 レイヤ/グループ 現在選択されているものを.

レイヤーパネル内のレイヤーツールバー
注釈
レイヤパネルを管理するツールは、印刷レイアウトのマップアイテムと凡例アイテムにも使用できます。
マップテーマの構成
The Manage Map Themes drop-down button provides access to
convenient shortcuts to manipulate visibility of the layers in the Layers
panel:
 全てのレイヤを表示
 全てのレイヤを隠す
 選択レイヤの表示
 選択レイヤを隠す
 選択されていないレイヤを隠す
レイヤーの可視性の単純な制御を超えて、 地図主題の管理 メニューを使用すると、凡例で 地図主題 を構成し、地図主題間で切り替えできます。地図主題とは、以下を記録する現在の地図凡例の スナップショット です:
the layers set as visible in the Layers panel
and for each visible layer:
the reference to the style applied to the layer
the visible classes of the style, ie the layer checked node items in the Layers panel. This applies to symbologies other than the single symbol rendering
the collapsed/expanded state of the layer node(s) and the group(s) it's placed inside
To create a map theme:
Check a layer you want to show
Configure the layer properties (symbology, diagram, labels...) as usual
Expand the menu at the bottom and click on Add... to store the settings as a new style embedded in the project
注釈
地図テーマは、プロパティの現在の詳細を記憶しません。スタイル名への参照のみが保存されるため、このスタイルが有効なときにレイヤーに変更を適用する(たとえば、シンボルレンダリングを変更する)と、テーテーマは新情報で更新されます。
Repeat the previous steps as necessary for the other layers
If applicable, expand or collapse groups or visible layer nodes in the Layers panel
Click on the
Manage Map Themes button on top of the panel,
and Add Theme...Enter the map theme's name and click OK
The new theme is listed in the lower part of the drop-down menu.
必要な数だけ地図テーマを作成できます。地図凡例の現在の組み合わせ(表示レイヤ、アクティブスタイル、地図凡例ノード)が上記で定義された既存の地図テーマ内容と一致しない場合は、 テーマを追加... をクリックして新しい地図テーマを作成するか、 を使用して地図テーマを更新します。アクティブなテーマを削除するには、 ボタンを使用します。
地図テーマは、事前に構成されたさまざまな組み合わせをすばやく切り替えるのに役立ちます。リストで地図テーマを選択して、その組み合わせを復元します。設定されたすべてのテーマは印刷レイアウトでもアクセスでき、特定のテーマに基づいて、現在のメインキャンバスレンダリングとは関係なく、異なる地図アイテムを作成できます( 地図アイテムレイヤー )を参照。
レイヤーパネルのコンテキストメニューの概要
ツールバーの下、[レイヤー]パネルの主要コンポーネントは、プロジェクトに追加されたベクタまたはラスタレイヤをリストしたフレームで、オプションでグループにまとめられます。右クリックすると、パネルで選択したアイテムに応じて、以下に示す専用のオプションセットが表示されます。
オプション |
ベクターレイヤー |
ラスターレイヤー |
グループ |
|---|---|---|---|
|
|
|
|
|
|
||
|
|
|
|
地物数表示 |
|
||
Copy Layer/Group |
|
|
|
Rename Layer/Group |
|
|
|
|
|
||
Stretch Using Current Extent |
|
||
|
|
||
|
|
||
|
|
|
|
|
|
|
|
Move Out of Group |
|
|
|
Move to Top |
|
|
|
Check and all its Parents |
|
|
|
Group Selected |
|
|
|
|
|
||
|
|
||
|
|
||
Filter... |
|
||
Set Layer Scale Visibility... |
|
|
|
Zoom to Visible Scale |
|
|
|
|
|
||
|
|
|
|
|
|
|
|
Set Group WMS Data... |
|
||
|
|
||
Check and all its children (Ctrl-click) |
|
||
Uncheck and all its children (Ctrl-click) |
|
||
Make Permanent |
|
||
|
|
|
|
|
|
||
|
|
||
|
|
||
|
|
|
|
|
|
|
|
|
|
||
|
|
|
|
|
|
|
|
|
|
|
|
|
|
|
|
Properties... |
|
|


表:レイヤーパネルの項目からコンテキストメニュー
GRASSベクターレイヤーについては、 編集切り替え は使用できません。GRASSベクターレイヤーの編集については、セクション GRASSベクターレイヤーをデジタル化して編集する を参照。
Interact with groups and layers
凡例ウィンドウのレイヤーをグループに編成できます。これを行うには2つの方法があります。
 アイコンを押して新しいグループを追加します。グループの名前を入力し Enter を押します。今、既存のレイヤーをクリックして、グループにドラッグします。
Select some layers, right-click in the legend window and choose Group Selected. The selected layers will automatically be placed in a new group.
レイヤをグループ外に移動するには、ドラッグするか、右クリックして グループ外に移動 を選択します。レイヤはグループ外に移動され、その上に配置されます。グループは、他のグループ内に入れ子にもできます。レイヤーが入れ子にされたグループに配置されている場合、 グループ外へ移動 は、すべての入れ子にされたグループの外にレイヤーを移動します。
グループまたはレイヤをレイヤパネルの最上に移動するには、それらを最上にドラッグするか、最上に移動 を選択します。グループに入れ子されたレイヤでこのオプションを使用すると、レイヤは現在のグループ中で最上部に移動します。
グループのチェックボックスを1回のクリックで、グループ内のすべてのレイヤーを表示または非表示になります。
Enabling the Mutually Exclusive Group option means you can make a group have only one layer visible at the same time. Whenever a layer within the group is set visible the others will be toggled not visible.
It is possible to select more than one layer or group at the same time by holding down the Ctrl key while clicking additional layers. You can then move all selected layers to a new group at the same time.
You may also delete more than one layer or group at once by selecting several items with the Ctrl key and then pressing Ctrl+D: all selected layers or groups will be removed from the layers list.
More information on layers and groups using indicator icon
In some circumstances, icons appears next to the layer or group in the Layers panel to give more information about the layer/group. These symbols are:
- to indicate that the layer is in edit mode and you can modify
the data
 to indicate that the layer being edited has some unsaved changes
 to indicate a filter applied
to the layer. Hover over the icon to see the filter expression and double-click
to update the setting
to indicate a filter applied
to the layer. Hover over the icon to see the filter expression and double-click
to update the setting to identify an embedded group or layer and the path to their original project file
 to remind you that the layer is a temporary scratch
layer and its content will be discarded when you
close this project. To avoid data loss and make the layer permanent, click
the icon to store the layer in any of the OGR vector formats supported by QGIS.
to remind you that the layer is a temporary scratch
layer and its content will be discarded when you
close this project. To avoid data loss and make the layer permanent, click
the icon to store the layer in any of the OGR vector formats supported by QGIS.
ベクターレイヤーのスタイルを編集する
レイヤパネルから、レイヤのレンダリングをすばやく簡単に変更するショートカットがあります。ベクタレイヤを右クリックして、リストで を選択します。
see the styles currently applied to the layer. If you defined many styles for the layer, you can switch from one to another and your layer rendering will automatically be updated on the map canvas.
現在のスタイルをコピーし、該当する場合、別のレイヤーからコピーしたスタイルを貼り付け
rename the current style, add a new style (which is actually a copy of the current one) or delete the current style (when multiple styles are available).
注釈
The previous options are also available for raster layers.
ベクタレイヤの地物がすべて同じ一意のシンボルを持つ、またはそれらが分類される(その場合、レイヤは、サブ項目として各クラスにツリー構造で表示される)かどうかを、次のオプションがレイヤーレベルまたはクラスレベルで利用可能です:
Edit Symbol... to open the シンボルセレクタ dialog to change any properties of the layer or feature symbol (symbol, size, color...). Double-clicking on a feature also opens the Symbol Selector dialog.
カラーセレクタ with a Color Wheel from which you can click a color to update the symbol fill color automatically. For convenience, Recent colors are available at the bottom of the color wheel.
- Show All Items and Hide All
Items to toggle on or off the visibility of all the classes of features. This avoids
(un)checking items one by one.
ちなみに
すぐにレイヤースタイルを共有します
コンテキストメニューから、レイヤのスタイルをコピーして、グループまたはレイヤの選択に貼り付けます。スタイルは、元のレイヤと同じタイプ(ベクタ/ラスタ)のすべてのレイヤに適用され、ベクタレイヤについては同じジオメトリタイプ(ポイント、ライン、またはポリゴン)を持ちます。
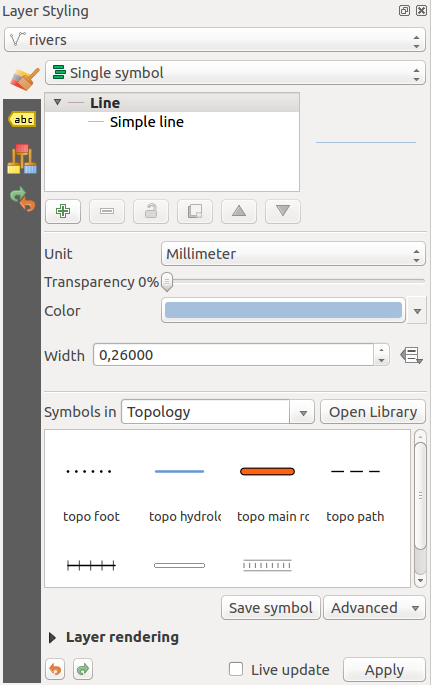
レイヤースタイル設定パネル
レイヤスタイリング パネル( Ctrl+3 でも有効)は、 レイヤプロパティ ダイアログの機能の一部へのショートカットです。レイヤのレンダリングと動作を定義し、レイヤプロパティダイアログを開かずにその効果を視覚化するための迅速かつ簡単な方法を提供します。
レイヤスタイリングパネルにより、遮断する(または「モーダル」)レイヤプロパティダイアログを避けるだけでなく、ダイアログで画面が乱雑になることも避けられ、ほとんどのスタイル機能(カラーセレクタ、効果プロパティ、ルール編集、ラベル置換...)が含まれます:たとえば、レイヤースタイルパネル内のカラーボタンをクリックすると、カラーセレクターダイアログが、個別のダイアログとしてではなく、レイヤスタイルパネル自体の内部で開かれます。
レイヤーパネルの現在のレイヤーのドロップダウンリストから項目を選択して:
Set raster layer
Symbology,  Transparency,
and
Transparency,
and  Histogram properties.
These options are the same as those in the ラスターのプロパティダイアログ.
Histogram properties.
These options are the same as those in the ラスターのプロパティダイアログ.Set vector layer
Symbology,  3D View and
 Labels properties.
These options are the same as those in the ベクタープロパティダイアログ.
Labels properties.
These options are the same as those in the ベクタープロパティダイアログ.Manage the associated style(s) in the
 Style Manager
(more details at カスタムスタイルを管理する).
Style Manager
(more details at カスタムスタイルを管理する).See the
 History of changes you applied to the
layer style in the current project: you can therefore cancel or restore to any
state by selecting it in the list and clicking Apply.
History of changes you applied to the
layer style in the current project: you can therefore cancel or restore to any
state by selecting it in the list and clicking Apply.
このパネルのもう1つの強力な機能は、  即時更新 チェックボックスです。チェックを入れると、変更が地図キャンバスにすぐに表示されます。 適用 ボタンをクリックする必要はなくなりました。
Defining a layer's symbology from the layer styling panel
ちなみに
Add custom tabs to the Layer Styling panel
Using PyQGIS, you can set new tabs to manage layer properties in the Layer Styling Panel. See https://nathanw.net/2016/06/29/qgis-style-dock-part-2-plugin-panels/ for an example.
Layer Order Panel
By default, layers shown on the QGIS map canvas are drawn following their order in the Layers panel: the higher a layer is in the panel, the higher (hence, more visible) it'll be in the map view.
レイヤ順序 パネルを メニューまたは Ctrl+9 で有効にすると、レイヤパネルの順序に関係なく、レイヤの描画順序を定義できます。レイヤのリストの下にある レンダリング順序を制御 チェックし、必要に応じてパネル内のレイヤを再編成します。この順序は、地図キャンバスに適用される順序になります。たとえば、 figure_layer_order では、レイヤのレイヤパネルでのそれぞれの配置にかかわらず、「airports」地物が「alaska」ポリゴンの上に表示されていることがわかります。
Unchecking Control rendering order will
revert to default behavior.

Define a layer order independent of the legend
Overview Panel
オーバービュー パネル( Ctrl+8 )は、いくつかのレイヤの全範囲ビューの地図を表示します。オーバービュー地図は、 メニューまたはレイヤのコンテキストメニューの オーバービューに表示 オプションを使用するレイヤーで埋められます。ビュー内では、赤い長方形は現在の地図キャンバス範囲を示し、地図全体のどの領域を現在表示しているか迅速に判断するのに役立ちます。概要フレーム内の赤い長方形をクリックしてドラッグすると、それに応じて主地図ビューの範囲が更新されます。
Note that labels are not rendered to the map overview even if the layers used in the map overview have been set up for labeling.
ログメッセージパネル
何らかの操作をロードまたは処理するときは、  ログメッセージパネル を使用して別のタブに表示されるメッセージを追跡し従うことができます。これは、下のステータスバーの最右側のアイコンを使用して有効にできます。
元に戻す/やり直しパネル
For each layer being edited, the Undo/Redo (Ctrl+5) panel shows the list of actions carried out, allowing you quickly to undo a set of actions by selecting the action listed above. More details at Undo and Redo edits.
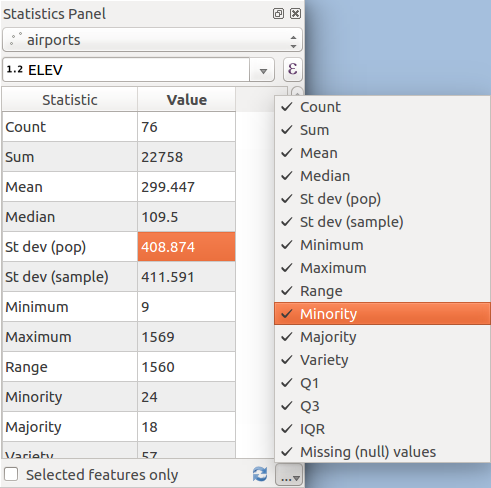
統計の概要パネル
The Statistics panel (Ctrl+6) provides summarized information on any vector layer. This panel allows you to select:
the vector layer to compute the statistics on
the column to use, or an
 expression
the statistics to return using the drop-down button at the bottom-right of the dialog. Depending on the field's (or expression's values) type, available statistics are:
統計 |
文字列 |
整数 |
浮動小数 |
日付 |
|---|---|---|---|---|
カウント |
|
|
|
|
個別の値をカウント |
|
|
||
欠損値をカウント |
|
|
||
和 |
|
|
||
平均 |
|
|
|
|
標準偏差 |
|
|
||
サンプルの標準偏差 |
|
|
||
最小値 |
|
|
|
|
最大値 |
|
|
|
|
範囲 |
|
|
|
|
少数 |
|
|
||
多数 |
|
|
||
多様 |
|
|
||
第一四分位 |
|
|
||
第三四分位 |
|
|
||
四分位範囲 |
|
|
||
最小の長さ |
|
|||
最大の長さ |
|
表:各フィールドタイプのために利用可能な統計
The statistical summary can be:
returned for the whole layer or
selected features onlyrecalculated using the
 button when the underlying data source changes
(eg, new or removed features/fields, attribute modification)
button when the underlying data source changes
(eg, new or removed features/fields, attribute modification) copied to the clipboard and pasted as a table in another application
フィールド上の統計情報を表示します
プロジェクトを入れ子にする
Sometimes, you'd like to keep some layers in different projects, but with the same style. You can either create a default style for these layers or embed them from another project to save time and effort.
既存のプロジェクトからの埋め込みレイヤーとグループには、スタイル設定を超える利点がいくつかあります:
All types of layers (vector or raster, local or online...) can be added
Fetching groups and layers, you can keep the same tree structure of the "background" layers in your different projects
埋め込まれたレイヤは編集可能ですが、シンボル、ラベル、フォーム、デフォルト値、アクションなどのプロパティを変更することはできず、プロジェクト全体で一貫性を確保できます
元のプロジェクト内の項目を変更し、変更は他のすべてのプロジェクトに反映されます。
If you want to embed content from other project files into your project, select :
Click the ... button to look for a project: you can see the content of the project (see figure_embed_dialog)
Hold down Ctrl ( or
 Cmd) and click on the layers and
groups you wish to retrieve
Cmd) and click on the layers and
groups you wish to retrieveClick OK
選択したレイヤとグループは レイヤ パネルに埋め込まれ、地図キャンバスに表示されます。 アイコンが認識のために名前の横に追加され、ホバーすると、元のプロジェクトファイルパスを含むツールチップが表示されます。
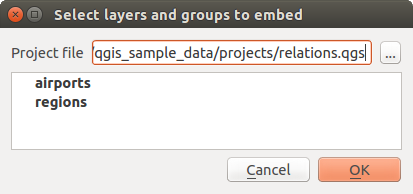
埋め込むためのレイヤーとグループを選択します
Like any other layer, an embedded layer can be removed from the project by
right-clicking on the layer and clicking Remove.
ちなみに
埋め込みレイヤーのレンダリングを変更する
元のプロジェクトファイルに変更を加えない限り、埋め込みレイヤーのレンダリングは変更できません。しかし、レイヤー上で右クリックして 複製 を選択すると、完全な機能を備えた、元のプロジェクトに依存していないレイヤーを作成します。その後、安全にリンクレイヤーを除去できます。
地図キャンバスで作業する
レンダリング
デフォルトでは、QGISは、地図キャンバスが更新されるたびすべての可視レイヤーをレンダリングします。地図キャンバスの更新を発生させるイベントは、次のとおりです。
adding a layer
panning or zooming
resizing the QGIS window
changing the visibility of a layer or layers
QGISではいくつかの方法でレンダリング処理を制御できます。
縮尺依存レンダリング
縮尺依存レンダリングでは、レイヤー(ラスターまたはベクター)が表示される最小および最大縮尺を指定できます。縮尺依存レンダリングを設定するには、凡例内のレイヤーをダブルクリックして プロパティ ダイアログを開きます。 レンダリング タブで、 縮尺依存可視性 をティックし、最小(この値は含まない) と 最大(この値を含む) 縮尺値を入力します。
You can also activate scale dependent visibility on a layer from the Layers panel. Right-click on the layer and in the context menu, select Set Layer Scale Visibility.
The  Set to current canvas scale button allow you to use
the current map canvas scale as boundary of the range visibility.
Set to current canvas scale button allow you to use
the current map canvas scale as boundary of the range visibility.
注釈
可視性縮尺の範囲外に地図の縮尺があるためにレイヤーが地図キャンバスに描画されていない場合、レイヤーはレイヤーパネル中でグレー表示され、新しいオプション 可視縮尺にズーム がレイヤーのコンテキストメニューに表示されます。それを選択すると、地図はそのレイヤーの最寄の可視性縮尺にズームされます。
地図レンダリングの制御
後述のように地図レンダリングは、さまざまな方法で制御できます。
描画の中断
To suspend rendering, click the Render checkbox in the
bottom-right corner of the status bar. When Render
is not checked, QGIS does not redraw the canvas in response to any of
the events described in the section レンダリング. Examples of when you
might want to suspend rendering include:
adding many layers and symbolizing them prior to drawing
adding one or more large layers and setting scale dependency before drawing
adding one or more large layers and zooming to a specific view before drawing
any combination of the above
レンダリング がチェックされるとレンダリングが有効になり、即座に地図キャンバスが更新されます。
レイヤー追加オプションの設定
描画せずに常に新しいレイヤを読み込むようにオプションを設定できます。 これは、レイヤーは地図に追加されますが、凡例中のその可視性チェックボックスがデフォルトでオフになることを意味します。 このオプションを設定するには、メニューオプション を選択し、 レンダリング タブをクリックしてください。 デフォルトで地図に追加された新しいレイヤーが表示される のチェックを外します。 その後地図に追加されたレイヤーは、デフォルトでオフ(非表示)になります。
描画の中断
地図の描画を停止するには、 Esc キーを押します。これにより地図キャンバスの更新は中断され、地図が部分的に描画されたままになります。地図の描画が停止するには、 Esc を押している間に少し時間がかかる場合があります。
注釈
現在描画中断機能は利用できません。これはQt4のポートに依存しています。なぜならばユーザーインターフェイス(UI)に問題が発生してクラッシュするからです。
描画品質への影響
QGISは地図のレンダリング品質に影響を与えるためのオプションを持っています。メニューオプション を選択して、 レンダリング タブをクリックし、 いくらか描画性能を犠牲に線のギザギザを少なく を選択または選択解除してください。
レンダリングの高速化
レンダリング速度を上げるいくつかの設定があります。 を使用してQGISのオプション]ダイアログボックスを開き、 レンダリング タブに行って、次のチェックボックスを選択または選択解除します:
- Use render caching where possible to speed up redraws.
- 多くのCPUコアを使用して並列にレイヤーをレンダリング してから 最大コアを使用 を設定する。
地図は、バックグラウンドで別々の画像上に
地図更新間隔 毎にレンダリングされ、この(オフスクリーン)画像の内容は表示画面の表示を更新するために取られます。ただし、レンダリングがこの期間よりも早く終了した場合は、それは瞬時に表示されます。With
Enable Feature simplification by default for newly
added layers, you simplify features' geometry (fewer nodes) and as a result,
they display more quickly.
Be aware that this can cause rendering inconsistencies.
ズームとパン
QGISは関心のお住まいの地域にズームするためのツールとパンを提供します。
Apart from using the  pan and
  zoom-in/
 zoom-out icons on the toolbar
with the mouse, you can also navigate with the mouse wheel, spacebar
and arrow keys. A Zoom factor can be set under the
zoom-out icons on the toolbar
with the mouse, you can also navigate with the mouse wheel, spacebar
and arrow keys. A Zoom factor can be set under the
 menu to define the scale behavior while zooming.
マウスホイールで
You can press the mouse wheel to pan inside of the main window (on macOS, you may need to hold down the cmd key). You can roll the mouse wheel to zoom in and out on the map; the mouse cursor position will be the center of the zoomed area of interest. Holding down Ctrl while rolling the mouse wheel results in a finer zoom.
矢印キーで
Panning the map is possible with the arrow keys. Place the mouse cursor inside the map area, and click on the arrow keys to pan up, down, left and right.
また、スペースバーを使用すると、マウスの動きで一時的に地図をパンできます。キーボードの PgUp と PgDown キーは地図表示がズーム倍率のセットを、次のズームインまたはズームアウトします。 Ctrl + + または Ctrl + - を押しても地図キャンバス上ですぐにズームイン/アウトを実行します。
When certain map tools are active (Identify, Measure...), you can perform a zoom by holding down Shift and dragging a rectangle on the map to zoom to that area. This is not enabled for selection tools (since they use Shift for adding to selection) or edit tools.
空間ブックマーク
空間ブックマークによって、地理的な位置に「ブックマーク」付けして後でそこに戻れるようにできます。デフォルトではブックマークはコンピュータに保存されます。つまりブックマークは同一のコンピュータ内のどのプロジェクトからも利用できます。プロジェクトファイル( .qgs)にブックマークを保存したい場合は、 プロジェクト内 チェックボックスを選択してください。
ブックマークを作成する
ブックマークをを作成するには:
関心のある領域にズームまたはパンします。
Select the menu option or press Ctrl+B. The Spatial Bookmarks panel opens with the newly created bookmark.
ブックマークを説明する名称(255文字まで)を入力します。
プロジェクトファイル内にブックマークを保存したい場合は、 プロジェクト内 ボックスをチェックしてください。
Enter を押してブックマークを追加するか、他の場所をクリックします。
同じ名称で複数のブックマークを所有できることにご注意ください。
ブックマークを操作する
To use or manage bookmarks, select or press Ctrl+7. The Spatial Bookmarks panel allows you to:
ブックマークにズームする:希望のブックマークを選択し、 ブックマークにズーム をクリックします。それをダブルクリックしてもブックマークにズームできます。
ブックマークを削除する:ブックマークを選択して ブックマークを削除 をクリックします。選択を確認してください。
Import or Export a bookmark: To share or transfer your bookmarks between computers you can use the Import/Export Bookmarks drop-down menu to export all bookmarks to an
.xmlfile or import bookmarks from such a file.
You can also zoom to saved bookmarks by typing the bookmark name in the locator.
整飾
装飾とは、グリッド、著作権ラベル、方位記号、スケールバー、レイアウト範囲です。これらは地図作成要素を追加することによって地図を「装飾」するために使用されます。
グリッド
 グリッド では座標のグリッドと座標注記を地図キャンバスに追加します。
Select to open the dialog.

グリッドダイアログ
Tick
Enable grid and set grid
definitions according to the layers loaded in the map canvas.Tick
Draw annotations and set
annotation definitions according to the layers loaded in the map canvas.Click Apply to verify that it looks as expected or OK if you're satisfied.
著作権ラベル
 Copyright label adds a copyright label to the map
using your choice of text.
Copyright label adds a copyright label to the map
using your choice of text.
Select to open the dialog
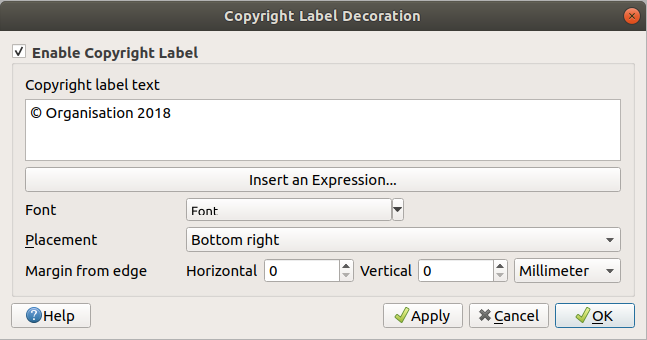
[著作権]ダイアログ
Make sure
Enable Copyright Label is checked.Enter the text you want to place on the map. You can include expressions (using the Insert an Expression button).
フォント
 コンボボックスからラベルのフォントを選択します。フォントコンボボックスの右側にある黒い矢印をクリックして、フォントの色と不透明度を設定します。
- 配置 コンボボックスからラベルの配置を選択してください。
水平および/または垂直の 縁からの余白 を設定することで、項目の配置を絞り込みます。これらの値は ミリ または ピクセル 単位として、または地図キャンバスの幅または高さの 割合 として設定できます。
You can change the color to apply
Click Apply to verify that it looks as expected or OK if you're satisfied.
In the example above, which is the default, QGIS places a copyright symbol followed by the date in the bottom-right corner of the map canvas.
北向き矢印
![]() North Arrow adds a north arrow on the map canvas,
with options for style and placement.
North Arrow adds a north arrow on the map canvas,
with options for style and placement.
To add a north arrow:
Select to open the dialog.
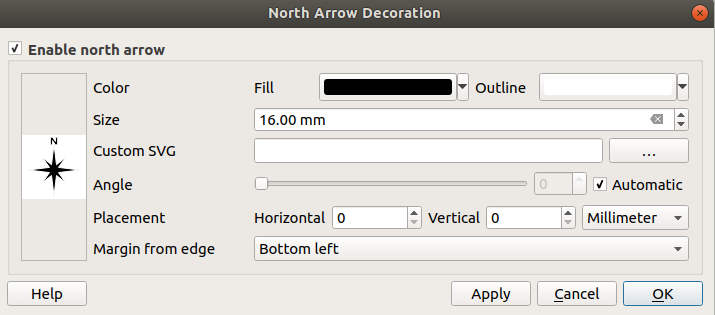
北向き矢印ダイアログ
Make sure
Enable north arrow is checkedOptionally change the color and size, or choose a custom SVG.
Optionally change the angle or choose Automatic to let QGIS determine the direction
Optionally choose the placement from the Placement combo box
必要に応じて、水平および/または垂直の (キャンバス)縁からの余白 を設定して矢印の配置を調整します。これらの値は ミリメートル または ピクセル で指定するか、地図キャンバスの幅または高さの 割合 として設定できます。
Click Apply to verify that it looks as expected and OK if you're satisfied.
スケールバー
 スケールバー は、地図キャンバスに、単純なスケールバーを追加します。スタイルや配置だけでなく、バーのラベルを制御できます。
QGIS only supports displaying the scale in the same units as your map frame. So, if the units of your project's CRS are meters, you can't create a scale bar in feet. Likewise, if you are using decimal degrees, you can't create a scale bar to display distance in meters.
スケールバーを追加するために:
Select to open the dialog

スケールバーダイアログ
Make sure
Enable scale bar is checkedChoose a style from the Scale bar style
combo boxSelect the Color of bar
 by choosing
a fill color (default: black) and an outline color (default: white). The scale
bar fill and outline can be made opaque by clicking on the down arrow to the right
of the color input.
by choosing
a fill color (default: black) and an outline color (default: white). The scale
bar fill and outline can be made opaque by clicking on the down arrow to the right
of the color input.Select the font for the scale bar from the Font of bar
combo boxSet the Size of bar

Optionally check
Automatically snap to round number
on resize to display easy-to-read valuesChoose the placement from the Placement
combo box水平および/または垂直の (キャンバス)縁からの余白 を設定することで、項目の配置を絞り込むことができます。これらの値は ミリ または ピクセル 単位として、または地図キャンバスの幅または高さの 割合 として設定できます。
Click Apply to verify that it looks as expected or OK if you're satisfied.
Layout Extents
 レイアウト範囲 は印刷レイアウトの 地図アイテム の範囲をキャンバスに追加します。 有効にすると、すべての印刷レイアウト内のすべての地図アイテムの範囲が、印刷レイアウトと地図アイテムの名前でラベル付けされた淡い点線の境界線を使用して表示されます。表示されたレイアウト範囲のスタイルとラベル付けを制御できます。この装飾は、ラベルなどの地図要素の位置を微調整していて、印刷レイアウトの実際の表示領域を知る必要がある場合に役立ちます。
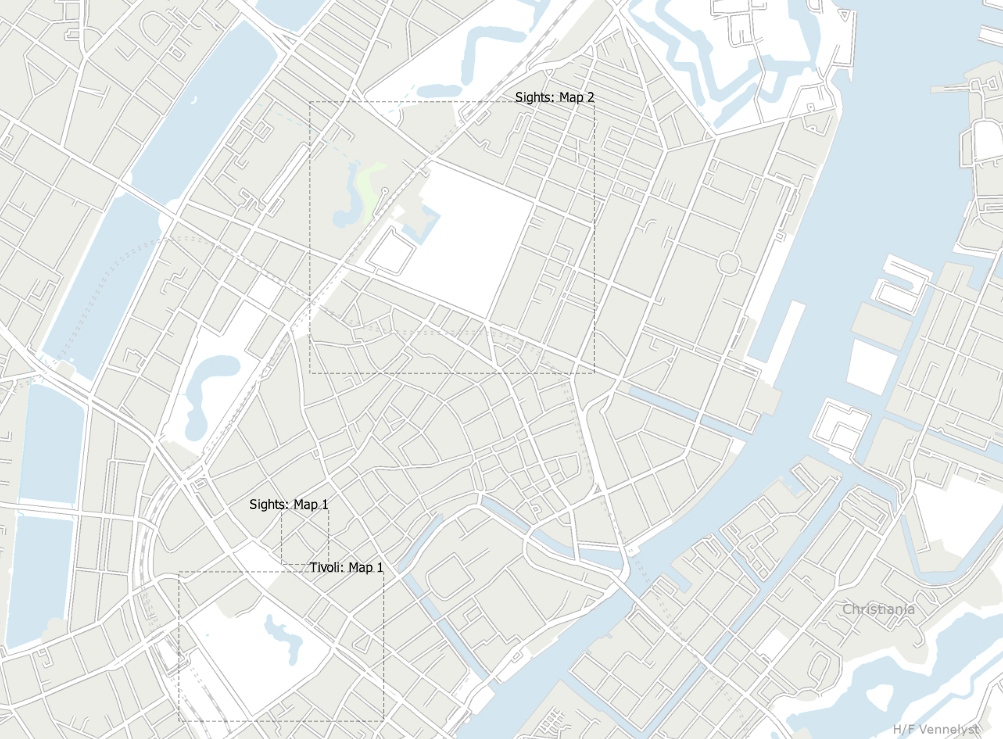
Example of layout extents displayed in a QGIS project with two print layouts. The print layout named 'Sights' contains two map items, while the other print layout contains one map item.
To add layout extent(s):
Select to open the dialog

The Layout Extents Dialog
Make sure
Show layout extents is checkedOptionally change the symbol and labeling of the extents
Click Apply to verify that it looks as expected and OK if you're satisfied
ちなみに
Decorations Settings
QGISプロジェクトファイルを保存する際、グリッド、方位記号、スケールバー、著作権およびレイアウト範囲に加えた変更はそのプロジェクトに保存され、次回プロジェクトをロードした際に復元されます。
注記ツール
注記は、地図キャンバスに追加されてバルーン内に表示される情報です。この情報は様々な種類のものが可能で、注釈は 属性ツールバー の対応するツールを使って追加されます。
 Text Annotation for custom formatted text
 HTML Annotation to place the content of an
 htmlfile SVG Annotation to add an
 SVGsymbol Form Annotation: useful to display attributes
of a vector layer in a customized
Form Annotation: useful to display attributes
of a vector layer in a customized uifile (see figure_custom_annotation). This is similar to the custom attribute forms, but displayed in an annotation item. Also see this video https://youtu.be/0pDBuSbQ02o?t=2m25s from Tim Sutton for more information.

Customized QT Designer annotation form
注記を追加するには、対応するツールを選択して地図キャンバスをクリックします。空のバルーンが追加されます。それをダブルクリックすると、さまざまなオプションを含むダイアログが開きます。このダイアログは、すべての注記タイプでほぼ同じです。
一番上には、注釈の種類に応じて
html,svgまたはuiファイルへのパスを入力するためのファイルセレクタがあります。テキスト注釈の場合は、テキストボックスにメッセージを入力して、通常のフォントツールを使用してそのレンダリングを設定できます。- 固定された地図位置:チェックを外すと、バルーンの配置は(地図ではなく)画面の位置に基づきます。つまり、地図のキャンバスの範囲に関係なく常に表示されます。
Linked layer: associates the annotation with a map layer, making it visible only when that layer is visible.
Map marker: using QGIS symbols, sets the symbol to display at the balloon anchor position (shown only when Fixed map position is checked).
Frame style: sets the frame background color, transparency, stroke color or width of the balloon using QGIS symbols.
Contents margins: sets interior margins of the annotation frame.

注記テキストダイアログ
注記ツールを有効にすると注記を選択できます。そのとき注記は、地図の位置で(地図のマーカーをドラッグ)またはバルーンだけを動かすことで移動できます。  注記を移動 ツールで地図キャンバス上のバルーンを移動させることもできます。
注記を削除するには、その注記を選択して Del または Backspace ボタンを押すか、またはその注記をダブルクリックしてプロパティダイアログの Delete ボタンを押します。
注釈
注記 ツール(注記移動、文字注記、注記フォーム )が有効な時に Ctrl+T を押すと、項目の可視属性が反転します。
ちなみに
Layout the map with annotations
You can print or export annotations with your map to various formats using:
map canvas export tools available in the menu
print layout, in which case you need to check Draw map canvas items in the corresponding map item properties
測定
一般情報
QGISは、ジオメトリを測定する4つの手段を提供します。
interactive measurement tools

measuring in the
 Field Calculator
derived measurements in the 地物を識別する tool
the vector analysis tool:
測定は投影された座標系(例えば、UTM)と非投影データ内で機能します。最初の3つの測定ツールは、グローバルなプロジェクト設定に対しても同様に動作します:
Unlike most other GIS, the default measurement metric is ellipsoidal, using the ellipsoid defined in . This is true both when geographic and projected coordinate systems are defined for the project.
If you want to calculate the projected/planimetric area or distance using cartesian maths, the measurement ellipsoid has to be set to "None/Planimetric" (). However, with a geographic (ie unprojected) CRS defined for the data and project, area and distance measurement will be ellipsoidal.
However, neither the identify tool nor the field calculator will transform your data to the project CRS before measuring. If you want to achieve this, you have to use the vector analysis tool: . Here, measurement is planimetric, unless you choose the ellipsoidal measurement.
対話的に長さ、面積、角度を計測
Click the icon in the Attribute toolbar to begin measurements.
The down arrow near the icon switches between
length,  area or
  angle.
The default unit used in the dialog is the one set in menu.
angle.
The default unit used in the dialog is the one set in menu.
注釈
測定ツールを設定する
長さや面積を測定している間、ウィジェットの一番下にある 設定 ボタンをクリックすると、 メニューが開きます。ここではラバーバンド色、測定の精度、そして単位の挙動を選択できます。好みの測度や角度の単位も選択できますが、現在のプロジェクト中ではこれらの値は メニューで行われた選択と測定ウィジェットで行われた選択によって上書きされることに注意してください。
すべての測定モジュールは、デジタル化モジュールからのスナップ設定を使用( スナップ許容誤差と検索半径の設定 セクションを参照)。正確にライン地物に沿って、またはポリゴン地物の周りを測定したいのであれば、最初にそのレイヤーのスナップ許容誤差を設定します。今、測定ツールを使用している場合(許容誤差の設定内)の各マウスクリックは、そのレイヤーにスナップします。
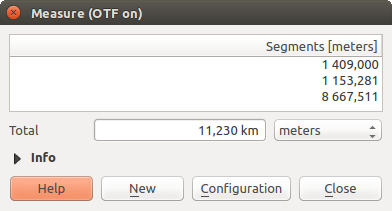
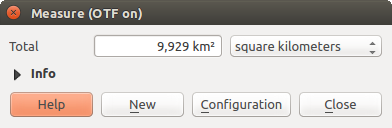
By default, Measure Line measures real distances
between given points according to a defined ellipsoid.
The tool then allows you to click points on the map. Each segment length,
as well as the total, shows up in the measure window.
To stop measuring, click the right mouse button.
計測ツールで作業中は、合計の近くにあるドロップダウンリストを操作しながら測定単位を対話的に変更できます、(「メートル」、「キロメートル」、「フィート」、「ヤード」、「マイル」、「海里」「センチメートル」、「ミリメートル」、「度」、「地図単位」)。この単位は、新しいプロジェクトが作成されるか、別のプロジェクトが開かれるまで、このウィジェットで保持されます。
The Info section in the dialog explains how calculations are made according to the CRS settings available.
距離を測定
Measure Area: Areas can also be measured. In the
measure window, the accumulated area size appears. Right-click to stop drawing.
The Info section is also available as well as the ability to switch between
different area units ('Square meters', 'Square kilometers', 'Square feet', 'Square yards',
'Square miles', 'Hectares', 'Acres', 'Square centimeters',
'Square millimeters', 'Square nautical miles', 'Square degrees', 'Map units').
面積を測定
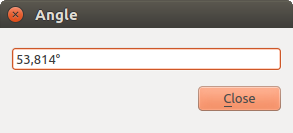
Measure Angle: You can also measure angles. The
cursor becomes cross-shaped. Click to draw the first segment of the angle you
wish to measure, then move the cursor to draw the desired angle. The measurement
is displayed in a pop-up dialog.
角度を測定
地物とのやりとり
地物を選択する
QGIS provides several tools to select features on the map canvas. Selection tools are available in the menu or in the Attributes toolbar.
注釈
選択ツールは、現在アクティブなレイヤーで動作します。
地図キャンバスで手動で選択する
To select one or more features with the mouse, you can use one of the following tools:
 エリアまたは単一クリックによって地物を選択
 ポリゴンで地物を選択
 フリーハンドで地物を選択
 半径で地物を選択
注釈
Other than Select Features by Polygon, these
manual selection tools allow you to select feature(s) on the map canvas with a
single click.
注釈
既存のポリゴンを使用して重なり合う地物を選択するには 地物をポリゴンで選択 ツールを使用してください。ポリゴンを右クリックして、クリックした点を含むすべてのポリゴンのリストを表示するコンテキストメニューからそれを選択します。アクティブレイヤーのすべての重なり合う地物が選択されます。
While using the Select Feature(s) tool,
holding Shift or Ctrl toggles whether a feature is selected
(ie either adds to the current selection or remove from it).
For the other tools, different behaviors can be performed by holding down:
Shift :地物を現在の選択に追加します
Ctrl :地物を現在の選択から除きます
Ctrl+Shift: intersect with current selection, ie only keep overlapping features from the current selection
Alt: select features that are totally within the selection shape. Combined with Shift or Ctrl keys, you can add or substract features to/from the current selection.
自動選択
他の選択ツールは、 属性テーブル からも利用できますが、地物の属性やその選択状態に基づいて選択を実行します(属性テーブルと地図のキャンバスは同じ情報を表示するので、属性テーブル内で1つの地物を選択した場合、それはまた、地図キャンバスでも選択されることに注意してください)。
 Select By Expression... select
features using expression dialog
Select By Expression... select
features using expression dialog 値で地物を選択... または F3 を押します
 Deselect Features from All Layers or press
Ctrl+Shift+A to deselect all selected features in all layers
Deselect Features from All Layers or press
Ctrl+Shift+A to deselect all selected features in all layers Select All Features or press Ctrl+A to select all
features in the current layer
Select All Features or press Ctrl+A to select all
features in the current layer Invert Feature Selection to invert the selection in
the current layer
Invert Feature Selection to invert the selection in
the current layer
例えば、QGISサンプルデータの regions.shp から自治区を探したい場合、 式を使用して地物を選択 アイコンを使用します。それから フィールドと値 グループを展開して問合せしたいフィールドを選択します。フィールド 'TYPE_2' をダブルクリックして、表示されたパネルの すべて一意 をクリックしてください。リストから「自治区」を選択してダブルクリックします。 式 フィールドに以下のクエリを書いてください:
"TYPE_2" = 'Borough'
式ビルダーダイアログから、 を使用して、以前に使用した選択を行うこともできます。ダイアログには最後に使用された20個の式が記憶されます。詳細および例は 式 を参照。
ちなみに
新しいファイルに選択を保存する
Users can save selected features into a New Temporary Scratch Layer or a New Vector Layer using and in the desired format.
値で地物を選択する
この選択ツールはレイヤーの地物フォームを開き、各フィールドで検索する値、大文字と小文字を区別するかどうか、使用する操作をユーザーが選択できるようにします。このツールには自動補完機能もあり、自動的に検索ボックスに既存の値を入力します。
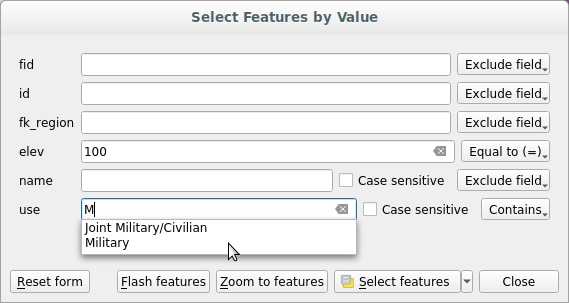
フォームダイアログを使用して地物をフィルタ/選択
Alongside each field, there is a drop-down list with options to control the search behaviour:
Field search option |
文字列 |
Numeric |
日付 |
|---|---|---|---|
Exclude Field from the search |
|
|
|
等しい(=) |
|
|
|
Not equal to (≠) |
|
|
|
より大きい(>) |
|
|
|
未満(<) |
|
|
|
Greater than or equal to (≥) |
|
|
|
Less than or equal to (≤) |
|
|
|
の間(包括的) |
|
|
|
Not between (inclusive) |
|
|
|
含む |
|
||
含まない |
|
||
欠落(ヌル) |
|
|
|
欠落していません(nullでない) |
|
|
|
Starts with |
|
||
Ends with |
|
For string comparisons, it is also possible to use the
Case sensitive option.
After setting all search options, click Select features to select the matching features. The drop-down options are:
地物を選択
現在の選択に追加
現在の選択をフィルタ
現在の現在の選択から削除
You can also clear all search options using the Reset form button.
Once the conditions are set, you can also either:
Zoom to features on the map canvas without the need of a preselection
:guilabel: 地物を点滅、一致する地物を強調表示します。これは、選択や[識別]ツールを使用せずに地物を識別するのに便利な方法です。点滅はマップキャンバスの範囲を変更せず、地物が現在の地図キャンバスの範囲内にある場合にのみ表示されますのでご注意ください。
地物を識別する
識別ツールを使用すると、地図キャンバスと相互作用して、ポップアップウィンドウ中に地物についての情報を取得できます。地物を識別するには以下を使用します:
Ctrl+Shift+I (or
Cmd+Shift+I), Identify Features icon on the Attributes toolbar
地物識別ツールを使用する
QGIS offers several ways to identify features with the
Identify Features tool:
left click identifies features according to the selection mode and the selection mask set in the Identify Results panel
right click with Identify Feature(s) as selection mode set in the Identify Results panel fetches all snapped features from all visible layers. This opens a context menu, allowing the user to choose more precisely the features to identify or the action to execute on them.
right click with Identify Features by Polygon as selection mode in the Identify Results panel identifies the features that overlap with the chosen existing polygon, according to the selection mask set in the Identify Results panel
ちなみに
地物識別ツールを使用して照会するレイヤーフィルタ
Under Layer Capabilities in , uncheck the Identifiable column next to a
layer to avoid it
being queried when using the Identify Features tool in a mode
other than Current Layer. This is a handy way to return features from
only layers that are of interest for you.
地物をクリックすると、 結果の識別 ダイアログにクリックされた地物に関する情報が一覧表示されます。 デフォルトビューはツリービューで、最初の項目はレイヤーの名前、その子は識別された地物です。 各地物は、フィールドの名前および値で記述されます。 このフィールドは で設定されたものです。 地物に関する他のすべての情報が続きます。
Feature information
The Identify Results dialog can be customized to display custom fields, but by default it will display the following information:
The feature display name;
アクション:アクションを地物識別ウィンドウに追加できます。アクションは、アクションのラベルをクリックすることで実行されます。デフォルトでは、1つのアクションだけ追加されます、すなわち編集のため
地物表示フォーム。レイヤーのプロパティダイアログでより多くのアクションを定義できます( アクションのプロパティ を参照)。Derived: This information is calculated or derived from other information. It includes:
general information about the feature's geometry:
depending on the geometry type, the cartesian measurements of length, perimeter or area in the layer's CRS units
depending on the geometry type and if an ellipsoid is set in the project properties dialog for Measurements, the ellipsoidal values of length, perimeter or area using the specified units
the count of geometry parts in the feature and the number of the part clicked
the count of vertices in the feature
coordinate information, using the project properties Coordinates display settings:
XandYcoordinate values of the point clickedthe number of the closest vertex to the point clicked
XandYcoordinate values of the closest vertex (andZ`/`Mif applicable)if you click on a curved segment, the radius of that section is also displayed.
データ属性 :これは、クリックされた地物の属性フィールドと値のリストです。
注釈
Links in the feature's attributes are clickable from the Identify Results panel and will open in your default web browser.

[識別結果]ダイアログ
識別結果ダイアログ
At the top of the window, you have a handful of tools:
 Open Form of the current feature
- ツリーを展開
- ツリーを折りたたむ
 Expand New Results by Default to define whether the next
identified feature's information should be collapsed or expanded
Expand New Results by Default to define whether the next
identified feature's information should be collapsed or expanded- 結果をクリア
- 選択地物をクリップボードにコピー
 選択されたHTMLレスポンスを印刷
selection mode to use to fetch features to identify:
 Identify Features by area or single click
 Identify Features by Polygon
 Identify Features by Freehand
 Identify Features by Radius
注釈
When using
Identify Features by Polygon, you can
right-click any existing polygon and use it to identify overlapping
features in another layer.
At the bottom of the window are the Mode and View comboboxes. Mode defines from which layers features should be identified:
Current layer: only features from the selected layer are identified. The layer need not be visible in the canvas.
Top down, stop at first: only features from the upper visible layer.
Top down: all features from the visible layers. The results are shown in the panel.
Layer selection: opens a context menu where the user selects the layer to identify features from, similar to a right-click. Only the chosen features will be shown in the result panel.
ビュー は 木 、 テーブル または グラフ として設定できます。「テーブル」と「グラフ」ビューはラスターレイヤーに対してのみ設定できます。
識別ツールを使用すると、 フォームを自動的に開く ことができます。 チェックすると、単一の地物が識別されるたびに、その属性を示すフォームが開きます。 これは、地物の属性をすばやく編集するための便利な方法です。
その他の機能は、識別されたアイテムのコンテキストメニューにあります。たとえば、コンテキストメニューから次のことができます:
地物フォームの表示
地物にズーム
地物をコピー: すべての地物のジオメトリと属性をコピーします;
Toggle feature selection: Add identified feature to selection
属性値をコピー: クリックした属性値のみをコピーします。
地物属性をコピー:地物の属性をコピーします。
結果をクリア:ウィンドウ内の結果が削除されます
ハイライトのクリア:地図上でハイライトしている地物が除去されます
すべてをハイライトする
レイヤーをハイライトする
レイヤーをアクティベート: アクティベートするレイヤの選択
レイヤープロパティ: レイヤープロパティウィンドウを表示する
すべてを展開する
すべてを折りたたむ
レイヤーのプロパティを保存および共有する
カスタムスタイルを管理する
ベクタレイヤが地図キャンバスに追加されると、QGISではデフォルトでランダムなシンボル/色を使用してその地物がレンダリングされます。ただし、 でデフォルトのシンボルを設定できます。これは、ジオメトリタイプに応じて新しく追加された各レイヤに適用されます。
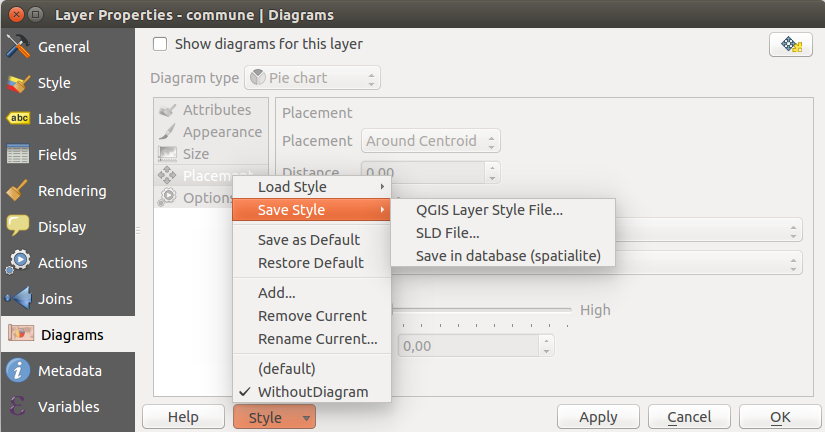
ただし、ほとんどの場合は、レイヤに自動的または手動で(より少ない労力で)適用できる、カスタムでより複雑なスタイルを使用することをお勧めします。 これを実現するには、「レイヤのプロパティ」ダイアログの下部にある メニューを使います。 このメニューには、スタイルを作成、ロード、管理するための機能があります。
A style stores any information set in the layer properties dialog to render or interact with the layer (including symbology, labeling, fields and form definitions, actions, diagrams...) for vector layers, or the pixels (band or color rendering, transparency, pyramids, histogram ...) for raster.
ベクターレイヤースタイルのコンボボックスのオプション
デフォルトでは、ロードされたレイヤーに適用されるスタイルは default という名前です。レイヤーのための理想的で適切なレンダリングを得たら、保存するには コンボボックスをクリックしてから以下を選択します:
Rename Current: The active style is renamed and updated with the current options
追加 :新しいスタイルは、現在のオプションを使用して作成されます。デフォルトでは、QGISプロジェクトファイルに保存されます。別のファイルやデータベースにスタイルを保存するには、以下を参照してください。
Remove: Delete unwanted style, in case you have more than one style defined for the layer.
At the bottom of the Style drop-down list, you can see the styles set for the layer with the active one checked.
Note that each time you validate the layer properties dialog, the active style is updated with the changes you've made.
You can create as many styles as you wish for a layer but only one can be active at a time. In combination with Map Themes, this offers a quick and powerful way to manage complex projects without the need to duplicate any layer in the map legend.
注釈
Given that whenever you apply modifications to the layer properties, changes are stored in the active style, always ensure you are editing the right style to avoid mistakenly altering a style used in a map theme.
ちなみに
レイヤーのコンテキストメニューからスタイルを管理します
Right-click on the layer in the Layers panel to add, rename or remove layer styles.
Storing Styles in a File or a Database
スタイル コンボボックスから作成したスタイルは、デフォルトではプロジェクト内に保存され、プロジェクト中でレイヤーからレイヤーへとコピーおよび貼り付けできますが、別のプロジェクトにロードできるようにプロジェクトの外にそれらを保存することもできます。
Save as text file
クリックすることで、スタイルは以下の形式で保存できます:
QGISレイヤースタイルファイル(
.qml)SLD file (
.sld), only available for vector layers
Used on file-based format layers (.shp, .tab...), Save
as Default generates a .qml file for the layer (with the same name).
SLDs can be exported from any type of renderer -- single symbol,
categorized, graduated or rule-based -- but when importing an SLD, either a
single symbol or rule-based renderer is created.
This means that categorized or graduated styles are converted to rule-based.
If you want to preserve those renderers, you have to use the QML format.
On the other hand, it can be very handy sometimes to have this easy way of
converting styles to rule-based.
データベースに保存
Vector layer styles can also be stored in a database if the layer datasource is a
database provider. Supported formats are PostGIS, GeoPackage, SpatiaLite, MSSQL
and Oracle. The layer style is saved inside a table (named layer_styles)
in the database. Click on
then fill in the dialog to define a style name, add a description, a .ui
file if applicable and to check if the style should be the default style.
You can save several styles for a single table in the database. However, each
table can have only one default style. Default styles can be saved in the layer
database or in the QGIS local database, a SQLite database in the ~/.qgis2/
directory (where QGIS stores its local settings).
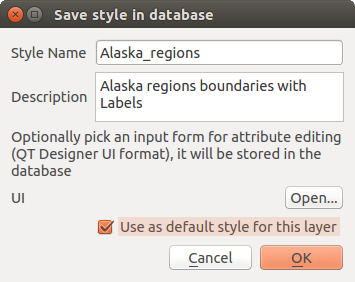
データベースダイアログでスタイルを保存
ちなみに
データベース間の共有スタイルファイル
レイヤーは、このようなデータベースから来ている場合にのみ、データベースにスタイルを保存できます。データベース(例えば、MSSQLでOracleにおけるレイヤーやスタイル)を混在させることはできません。スタイルは、データベース間で共有したい場合は代わりにプレーンテキストファイルを使用してください。
注釈
You may encounter issues restoring the layer_styles table from a
PostgreSQL database backup. Follow QGIS layer_style テーブルとデータベースのバックアップ to fix that.
スタイルをロード
When loading a layer in QGIS, if a default style already exists for this layer, QGIS loads the layer with this style. Also looks for and loads that file, replacing the layer's current style.
helps you apply any saved style to a
layer. While text-file styles (.sld or .qml) can be applied
to any layer whatever its format, loading styles stored in a database is only
possible if the layer is from the same database or the style is stored in the
QGIS local database.
The Database Styles Manager dialog displays a list of styles related to the layer found in the database and all the other styles saved in it, with name and description.
ちなみに
素早くプロジェクト内でレイヤースタイルを共有する
You can also share layer styles within a project without importing a file or database style: right-click on the layer in the Layers Panel and, from the Styles combobox , copy the style of a layer and paste it to a group or a selection of layers: the style is applied to all the layers that are of the same type (vector vs raster) as the original layer and, in the case of vector layers, have the same geometry type (point, line or polygon).
Layer definition file
レイヤー定義は、アクティブなレイヤーのコンテキストメニューで を使用して レイヤ定義ファイル ( .qlr )として保存できます。レイヤ定義ファイル( .qlr )には、レイヤのデータソースとそのスタイルへの参照が含まれています。 .qlr ファイルはブラウザパネルに表示され、レイヤパネルにレイヤ(保存されたスタイル)を追加するために使用できます。システムファイルマネージャから地図キャンバスに .qlr ファイルをドラッグアンドドロップすることもできます。
値を変数に格納する
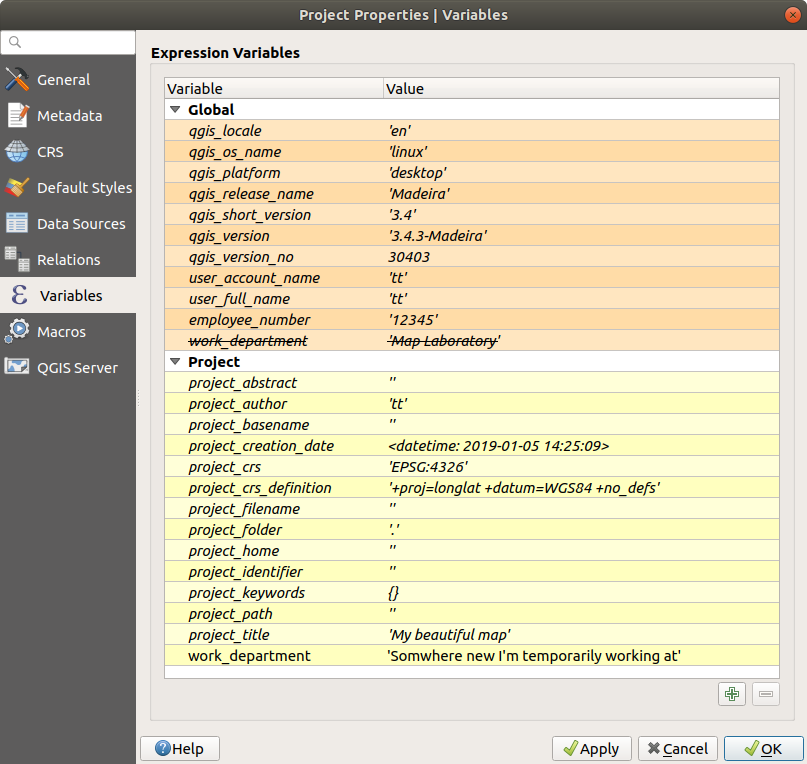
QGISでは、変数を使用して便利な頻出する値(プロジェクトのタイトル、ユーザーの氏名など)を保存し、それらを式で使用できます。変数は、アプリケーションのグローバルレベル、プロジェクトレベル、レイヤレベル、レイアウトレベル、レイアウトアイテムのレベルで定義できます。 CSSカスケードルールと同様に、変数は上書きできます。たとえば、プロジェクトレベルの変数は、同じ名前で設定されたアプリケーショングローバルレベルの変数を上書きします。これらの変数を使用して、変数名の前に「@」文字を使用してテキスト文字列または他のカスタム式を作成できます。たとえば、次の内容のラベルを作成する印刷レイアウトの場合:
This map was made using QGIS [% @qgis_version %]. The project file for this
map is: [% @project_path %]
このようなラベルをレンダリングします:
This map was made using QGIS 3.4.4-Madeira. The project file for this map is:
/gis/qgis-user-conference-2019.qgs
プリセット読み取り専用変数 のほかに、上記のいずれかのレベルのための独自のカスタム変数を定義できます。以下を管理できます:
global variables from the menu
project variables from the Project Properties dialog (see プロジェクトのプロパティ)
vector layer variables from the Layer Properties dialog (see ベクタープロパティダイアログ);
layout variables from the Layout panel in the Print layout (see レイアウトパネル);
and layout item variables from the Item Properties panel in the Print layout (see レイアウトアイテム共通オプション).
編集可能な変数と区別するために、読み取り専用変数の名前と値は、イタリック体で表示されます。一方、低いレベルのもので上書きされたより高いレベルの変数には取り消し線が引かれています。
Variables editor at the project level
注釈
You can read more about variables and find some examples in Nyall Dawson's Exploring variables in QGIS 2.12, part 1, part 2 and part 3 blog posts.
認証
QGIS has the facility to store/retrieve authentication credentials in a secure manner. Users can securely save credentials into authentication configurations, which are stored in a portable database, can be applied to server or database connections, and are safely referenced by their ID tokens in project or settings files. For more information see 認証システム.
マスターパスワードは、認証システムとそのポータブルデータベースを初期化する際に設定する必要があります。
共通のウィジェット
In QGIS, there are some options you'll often have to work with. For convenience, QGIS provides you with special widgets that are presented below.
カラーセレクタ
The color dialog
The Select Color dialog will appear whenever you click
the icon to choose a color. The features of this dialog
depend on the state of the Use native color chooser dialogs parameter
checkbox in .
When checked, the color dialog used is the native one of the OS on which QGIS is running. Otherwise,
the QGIS custom color chooser is used.
The custom color chooser dialog has four different tabs which allow you to
select colors by  Color ramp,
  Color wheel,
 Color swatches or
  Color picker.
With the first two tabs, you can browse to all possible color combinations and
apply your choice to the item.
Color picker.
With the first two tabs, you can browse to all possible color combinations and
apply your choice to the item.

カラーセレクタランプ]タブ
In the Color swatches tab, you can choose from a
list of color palettes (see 色の設定 for details).
All but the Recent colors palette can be modified with the
 Add current color and
  Remove selected color
buttons at the bottom of the frame.
Remove selected color
buttons at the bottom of the frame.
The ... button next to the palette combobox also offers several options to:
色をコピー、貼り付け、インポートまたはエクスポート
create, import or remove color palettes
add the custom palette to the color selector widget with the Show in Color Buttons item (see figure_color_selector)

Color selector swatches tab
Another option is to use the Color picker which allows
you to sample a color from under your mouse cursor at any part of the QGIS UI or even
from another application: press the space bar while the tab is active, move the
mouse over the desired color and click on it or press the space bar again. You
can also click the Sample Color button to activate the picker.
Whatever method you use, the selected color is always described through color
sliders for HSV (Hue, Saturation, Value) and RGB (Red, Green, Blue)
values. The color is also identifiable in HTML notation.
Modifying a color is as simple as clicking on the color wheel or ramp or on any of the color parameters sliders. You can adjust such parameters with the spinbox beside or by scrolling the mouse wheel over the corresponding slider. You can also type the color in HTML notation. Finally, there is an Opacity slider to set transparency level.
The dialog also provides a visual comparison between the
Old color (applied to object) and the Current one (being selected).
Using drag-and-drop or pressing the  Add color to
swatch button, any of these colors can be saved in a slot for easy access.
Add color to
swatch button, any of these colors can be saved in a slot for easy access.
ちなみに
クイックカラー変更
Drag-and-drop a color selector widget onto another one to apply its color.
The color drop-down shortcut
Click the drop-down arrow to the right of the color button
to display a widget for quick color selection. This shortcut provides access
to:
a color wheel to pick a color from
an alpha slider to change color opacity
the color palettes previously set to Show in Color Buttons
copy the current color and paste it into another widget
pick a color from anywhere on your computer display
choose a color from the color selector dialog

クイックカラーセレクタメニュー
The color ramp drop-down shortcut
Color ramps are a practical way to apply a set of colors to one or many features.
Their creation is described in the カラーランプ section. As for the colors,
pressing the  color ramp button opens the corresponding color
ramp type dialog allowing you to change its properties.
color ramp button opens the corresponding color
ramp type dialog allowing you to change its properties.

Customizing a colorbrewer ramp
The drop-down menu to the right of the button gives quick access to a wider set of color ramps and options:
Invert Color Ramp
a preview of the
gradientorcatalog: cpt-citycolor ramps flagged as Favorites in the Style Manager dialogAll Color Ramps to access the compatible color ramps database
Create New Color Ramp... of any supported type that could be used in the current widget (note that this color ramp will not be available elsewhere unless you save it in the library)
Edit Color Ramp..., the same as clicking the whole color ramp button
Save Color Ramp..., to save the current color ramp with its customizations in the style library

Quick color ramp selection widget
描画モード
QGIS offers different options for special rendering effects with these tools that you may previously only know from graphics programs. Blending modes can be applied on layers and features, and also on print layout items:
通常:これは標準のブレンドモードで、トップピクセルのアルファチャンネルを使用してその下のピクセルとブレンドします。色は混合されません。
明るく:これは、前景と背景の画素から各成分の最大値を選択します。結果はギザギザで粗くなる傾向があることに注意してください。
Screen: Light pixels from the source are painted over the destination, while dark pixels are not. This mode is most useful for mixing the texture of one item with another item (such as using a hillshade to texture another layer).
Dodge: Brighten and saturate underlying pixels based on the lightness of the top pixel. Brighter top pixels cause the saturation and brightness of the underlying pixels to increase. This works best if the top pixels aren't too bright. Otherwise the effect is too extreme.
Addition: Adds pixel values of one item to the other. In case of values above the maximum value (in the case of RGB), white is displayed. This mode is suitable for highlighting features.
Darken: Retains the lowest values of each component of the foreground and background pixels. Like lighten, the results tend to be jagged and harsh.
Multiply: Pixel values of the top item are multiplied with the corresponding values for the bottom item. The results are darker.
Burn: Darker colors in the top item cause the underlying items to darken. Burn can be used to tweak and colorize underlying layers.
Overlay: Combines multiply and screen blending modes. Light parts become lighter and dark parts become darker.
Soft light: Very similar to overlay, but instead of using multiply/screen it uses color burn/dodge. This is supposed to emulate shining a soft light onto an image.
ハードライト:ハードライトもオーバーレイモードと非常によく似ています。画像上に非常に強い光を投射するのを真似ているとされます。
Difference: Subtracts the top pixel from the bottom pixel, or the other way around, in order always to get a positive value. Blending with black produces no change, as the difference with all colors is zero.
Subtract: Subtracts pixel values of one item from the other. In the case of negative values, black is displayed.
データ定義の上書きの設定
Next to many options in the vector layer properties dialog or settings in the print
layout, you will find a  Data defined override icon.
Using expressions based on layer attributes or item
settings, prebuilt or custom functions and variables,
this tool allows you to set dynamic values for parameters. When enabled,
the value returned by this widget is applied to the parameter regardless of its normal
value (checkbox, textbox, slider...).
Data defined override icon.
Using expressions based on layer attributes or item
settings, prebuilt or custom functions and variables,
this tool allows you to set dynamic values for parameters. When enabled,
the value returned by this widget is applied to the parameter regardless of its normal
value (checkbox, textbox, slider...).
The data defined override widget
Clicking the Data defined override icon shows the following entries:
Description... that indicates if the option is enabled, which input is expected, the valid input type and the current definition. Hovering over the widget also pops up this information.
Store data in the project: a button allowing the property to be stored using to the Auxiliary Storage Properties mechanism.
Field type: an entry to select from the layer's fields that match the valid input type.
An entry to list the Variable available.
Edit... button to create or edit the expression to apply, using the Expression String Builder dialog. To help you correctly fill in the expression, a reminder of the expected output's format is provided in the dialog.
Paste and Copy buttons.
クリア ボタンで設定を削除
For numeric and color properties, Assistant... to rescale how the feature data is applied to the property (more details below)
ちなみに
Use right-click to (de)activate the data override
When the data-defined override option is set up correctly the
icon is yellow  or
or  . If it is broken,
the icon is red
. If it is broken,
the icon is red  or
or  .
.
You can enable or disable a configured data-defined
override button by simply clicking the widget with the right mouse button.
Using the data-defined assistant interface
When the Data-defined override button is associated with a
numeric or color parameter, it has an Assistant... option that
allows you to change how the data is applied to the parameter for each
feature. The assistant allows you to:
Define the Input data, ie:
the attribute to represent, using the Field listbox or the
Set column expression function (see 式)the range of values to represent: you can manually enter the values or use the
Fetch value range from layer button to fill
these fields automatically with the minimum and maximum values returned by the chosen
attribute or the expression applied to your data
 Apply transform curve: by default, output values (see
below for setting) are applied to input features following a linear scale.
You can override this logic: enable the transform option, click on the
graphic to add break point(s) and drag the point(s) to apply a custom
distribution.
Apply transform curve: by default, output values (see
below for setting) are applied to input features following a linear scale.
You can override this logic: enable the transform option, click on the
graphic to add break point(s) and drag the point(s) to apply a custom
distribution.Define the Output values: the options vary according to the parameter to define. You can globally set:
the minimum and maximum values to apply to the selected property (n case of a color setting, you'll need to provide a color ramp)
the Scale method of representation which can be Flannery, Exponential, Surface or Radius
the Exponent to use for data scaling
the output value or color to represent features with NULL values
When compatible with the property, a live-update preview is displayed in the right-hand side of the dialog to help you control the value scaling.
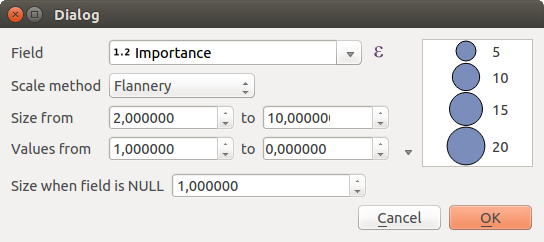
The data-defined size assistant
The values presented in the varying size assistant above will set the size 'Data-defined override' with:
coalesce(scale_exp(Importance, 1, 20, 2, 10, 0.57), 1)