Peralatan Umum
- Shortcut Papanketik
- Konteks Bantuan
- Rendering
- Color Selector
- Blending Modes
- Zooming and Panning
- Mengukur
- Pilih dan lepas fitur
- Data defined override setup
- Fitur Identifikasi
- Peralatan Anotasi
- Bookmark Spasial
- Proyek-proyek Nesting
- Dekorasi
- Authentication
- Save layer into file
- Use of variables for dynamic content
Shortcut Papanketik
QGIS provides default keyboard shortcuts for many features. You can find them in section Bar Menu. Additionally, the menu option Settings ‣ Configure Shortcuts... allows you to change the default keyboard shortcuts and add new keyboard shortcuts to QGIS features.
Figure Shortcuts 1:
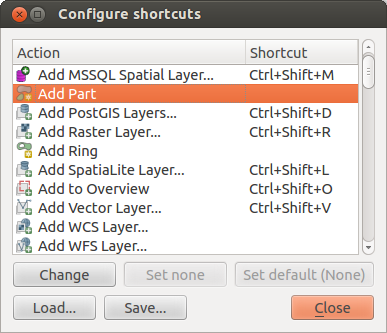
Define shortcut options
Configuration is very simple. Just select a feature from the list and click on :
- [Change] and press the new combination you want to assign as new shortcut
- [Set none] to clear any assigned shortcut
- or [Set default] to backup the shortcut to its original and default value.
Once you have finished your configuration, you can save it as an XML file and load it to another QGIS installation.
Konteks Bantuan
Saat Anda membutuhkan bantuan dengan topik yang spesifik, Anda dapat mengakses konteks bantuan melalui tombol [Bantuan] tersedia disebagian besar dialog - harap dicatat bahwa plugin pihak ketiga dapat mengarah ke halaman web khusus.
Rendering
By default, QGIS renders all visible layers whenever the map canvas is refreshed. The events that trigger a refresh of the map canvas include:
Menambahkan lapisan (layer)
Menggeser atau memperbesar
- Resizing the QGIS window
Merubah visitabilitas dari lapisan (layer)
QGIS allows you to control the rendering process in a number of ways.
Scale Dependent Rendering
Skala render memungkinkan Anda untuk menentukan skaa minimum dan skala maksimum di mana lapisan akan terlihat. Untuk mengatur skala render bergantung, buka dialog Properti dengan mengklik-dobel pada lapisan di legenda. Pada tab Umum klik pada kotak centang  Skala bergantung pada visibilitas untuk mengaktifkan fitur, kemudian atur nilai maskimum dan minimum skala.
You can determine the scale values by first zooming to the level you want to use and noting the scale value in the QGIS status bar.
Mengontrol Rendering Peta
Map rendering can be controlled in various ways, as described below.
Menunda Rendering
To suspend rendering, click the Render checkbox in the
lower right corner of the status bar. When the Render
checkbox is not checked, QGIS does not redraw the canvas in response to any of
the events described in section Rendering. Examples of when you
might want to suspend rendering include:
Menambah banyak lapisan dan melambangkan mereka sebelum menggambar
Menambahkan satu atau lebih lapisan besar dan mengatur ketergantungan skala sebelum menggambar
Menambahkan satu atau lebih lapisan besar dan perbesar ke tampilan spesifik sebelum menggambar
Kombinasi dari yang ada di atas
Aktifkan kotak centang Render mengaktifkan rendering dan dan menyebabkan refresh langsung dari kanvas peta.
Pengaturan Lapisan Tambah Opsi
Anda dapat mengatur pilihan untuk selalu memuat lapisan baru tanpa menggambar mereka. Ini berarti lapisan akan ditambahkan ke peta, namun visibilitas kotak centang dalam legenda akan dicentang secara default. Untuk mengatur opsi ini, pilih menu opsi Pengaturan ‣ Opsi dan klik tab Rendering. Hapus centang Secara standar lapisan baru ditambahkan ke peta selalu ditampilkan. Setiap lapisan ditambahkan ke peta akan tidak terlihat secara standar.
Menghentikan Rendering
Untuk menghentikan penggambaran peta, tekan tombol ESC. Ini akan menghentikan refresh kanvas peta dan menghentikan proses penggambaran peta. Hal ini mungkin membutuhkan waktu selama menekan ESC dan penggambaran peta terhenti.
Catatan
Saat ini tidak memungkikan untuk menghentikan rendering - ini dinonaktifkan di port qt4 karena masalah antarmuka pengguna (UI) dan konflik (crash).
Mempengarui Kualitas Rendering
QGIS has an option to influence the rendering quality of the map. Choose menu
option Settings ‣ Options, click on the Rendering
tab and select or deselect Make lines appear less jagged
at the expense of some drawing performance.
Mempercepat rendering
There are some settings that allow you to improve rendering speed. Open the QGIS options dialog using Settings ‣ Options, go to the Rendering tab and select or deselect the following checkboxes:
- Gunakan render caching yang memungkinkan mempercepat gambar ulang
- Render layers in parallel using many CPU cores and then
set the Max cores to use.
- The map renders in the background onto a separate image and each
Map Update interval, the content from this
(off-screen) image will be taken to update the visible screen representation.
However, if rendering finishes faster than this duration, it will be shown
instantaneously.
- With Enable Feature simplification by default for newly
added layers, you simplify features’ geometry (less nodes) and as a result,
they quickly display.
Be aware that you can also face rendering inconsistencies.
Color Selector
The select color dialog will appear whenever you push
the  icon to choose a color. The features of this dialog
depends on the state of the Use native color chooser dialogs parameter
checkbox in Settings ‣ Options ‣ General menu.
When checked, the color dialog used is the one of the OS being used. Otherwise,
QGIS custom color chooser is used.
icon to choose a color. The features of this dialog
depends on the state of the Use native color chooser dialogs parameter
checkbox in Settings ‣ Options ‣ General menu.
When checked, the color dialog used is the one of the OS being used. Otherwise,
QGIS custom color chooser is used.
This dialog has four different tabs which allow you to select colors by
 color ramp,
  color wheel,
 color swatches or
  color picker
(not available under
color picker
(not available under  ).
).
Whatever method you use, the selected color is always described through color sliders for HSV (Hue, Saturation, Value) and RGB (Red, Green, Blue) values. There is also an opacity slider to set transparency level. On the lower left part of the dialog you can see a comparison between the current and the new color you are presently selecting and on the lower right part you have the option to add the color you just tweaked into a color slot button.
Figure color selector 1:
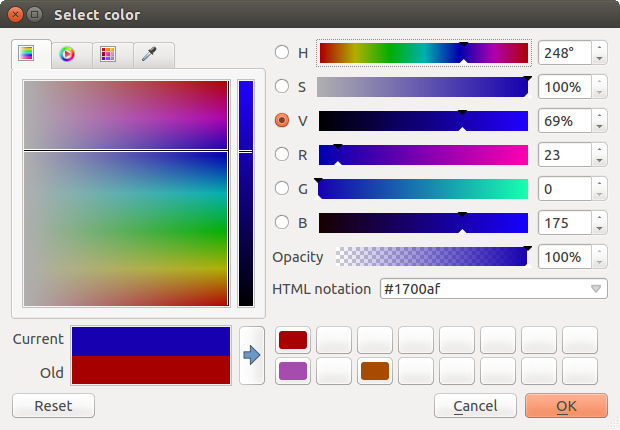
Color selector ramp tab
Tip
Dynamically change the color with the live-updating option
Check the Use live-updating color chooser dialogs option in the General Settings to have the color applied to your items as you change color parameters in the QGIS custom color chooser dialog.
With color ramp or with color wheel,
you can browse to all possible color combinations.
There are other possibilities though. By using color swatches
you can choose from a preselected list. This selected list is
populated with one of three methods:
- Recent colors,
- Standard colors, a user-defined list of colors set under Settings ‣ Options ‣ Colors menu
- or Project colors, a user-defined list of colors set under Project ‣ Project Properties ‣ Default Styles.
Figure color selector 2:
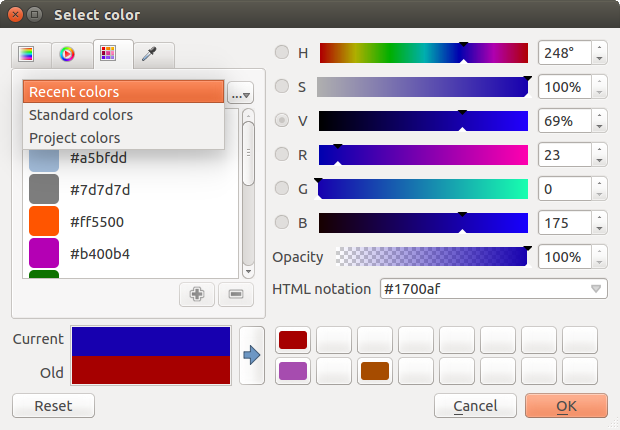
Color selector switcher tab
Another option is to use the color picker which allows
you to sample a color from under your mouse pointer at any part of
QGIS or even from another application by pressing the space bar. Please note
that the color picker is OS dependent and is currently not supported by OSX.
Tip
quick color picker + copy/paste colors
You can quickly choose from Recent colors, from Standard colors
or simply copy or paste a color by clicking
the drop-down arrow that follows the color box.
Figure color selector 3:
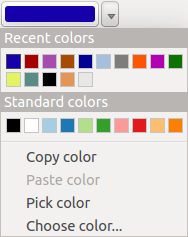
Quick color selector menu
Blending Modes
QGIS offers different options for special rendering effects with these tools that you may previously only know from graphics programs. Blending modes can be applied on layers, on features but also on print composer items:
- Normal: This is the standard blend mode, which uses the alpha channel of the top pixel to blend with the pixel beneath it. The colors aren’t mixed.
- Lighten: This selects the maximum of each component from the foreground and background pixels. Be aware that the results tend to be jagged and harsh.
- Screen: Light pixels from the source are painted over the destination, while dark pixels are not. This mode is most useful for mixing the texture of one item with another item (e.g., you can use a hillshade to texture another layer).
- Dodge: Dodge will brighten and saturate underlying pixels based on the lightness of the top pixel. So, brighter top pixels cause the saturation and brightness of the underlying pixels to increase. This works best if the top pixels aren’t too bright; otherwise the effect is too extreme.
- Addition: This blend mode simply adds pixel values of one item with the other. In case of values above one (in the case of RGB), white is displayed. This mode is suitable for highlighting features.
- Darken: This creates a resultant pixel that retains the smallest components of the foreground and background pixels. Like lighten, the results tend to be jagged and harsh.
- Multiply: Here, the numbers for each pixel of the top item are multiplied with the corresponding pixels for the bottom item. The results are darker pictures.
- Burn: Darker colors in the top item cause the underlying items to darken. Burn can be used to tweak and colorise underlying layers.
- Overlay: This mode combines the multiply and screen blending modes. In the resulting picture, light parts become lighter and dark parts become darker.
- Soft light: This is very similar to overlay, but instead of using multiply/screen it uses color burn/dodge. This is supposed to emulate shining a soft light onto an image.
- Hard light: Hard light is also very similar to the overlay mode. It’s supposed to emulate projecting a very intense light onto an image.
- Difference: Difference subtracts the top pixel from the bottom pixel, or the other way around, to always get a positive value. Blending with black produces no change, as the difference with all colors is zero.
- Subtract: This blend mode simply subtracts pixel values of one item from the other. In case of negative values, black is displayed.
Zooming and Panning
QGIS provides tools to zoom and pan to your area of interest.
Apart from using the  pan and
  zoom-in /
  zoom-out icons on the toolbar
with the mouse, navigating can also be done with the mouse wheel, spacebar
and the arrow keys.
zoom-out icons on the toolbar
with the mouse, navigating can also be done with the mouse wheel, spacebar
and the arrow keys.
Zooming and panning with the mouse wheel
You can press the mouse wheel to pan inside of the main
window, and you can roll the mouse wheel to zoom in and out on the map.
For zooming, place the mouse cursor inside the map area and roll it forward
(away from you) to zoom in and backwards (towards you) to zoom out. The mouse
cursor position will be the center of the zoomed area of interest. You can
customize the behavior of the mouse wheel zoom using the Map tools
tab under the Settings ‣  Options menu.
Panning with the arrow keys
Panning the map is possible with the arrow keys. Place the mouse cursor inside the map area, and click on the right arrow key to pan east, left arrow key to pan west, up arrow key to pan north, and down arrow key to pan south.
You can also use the space bar to temporarily cause mouse movements to pan the map. The PgUp and PgDown keys on your keyboard will cause the map display to zoom in or out.
Mengukur
QGIS provides four means of measuring geometries:
- the interactive measurement tools
 ,
, - measuring in the
 Field Calculator,
 - derived measures in the Fitur Identifikasi tool,
- and a vector analysis tool: Vector ‣ Geometry Tools ‣ Export/Add Geometry Columns
Measuring works within projected coordinate systems (e.g., UTM) and unprojected data. The first three measuring tools behave equally to global project settings:
If “on the fly” CRS transformation is enabled, the default measurement metric is - different from most other GIS - ellipsoidal, using the ellipsoid defined in File ‣ Project properties ‣ General. This is true both when geographic and projected coordinate systems are defined for the project. If you want to calculate the projected / planimetric area or distance using cartesian maths, the measurement ellipsoid has to be set to “None / Planimetric” (File ‣ Project properties ‣ CRS). However, with a geographic (= unprojected) CRS defined for the data and project, area and distance measurement will be ellipsoidal. If “on the fly” CRS transformation is disabled, the measurement metric is planimetric when the project coordinate system is projected and ellipsoidal when the project coordinate system is unprojected / geographic.
However, neither the identify tool nor the field calculator will transform your data to the project CRS before measuring. If you want to achieve this, you have to use the vector analysis tool: Vector ‣ Geometry Tools ‣ Export/Add Geometry Columns. Here, measurement is by default planimetric except if you choose the ellipsoidal measure.
Measure length, areas and angles interactive
All measuring modules use the snapping settings from the digitizing module. This is useful, if you want to measure along lines or areas in vector layers.
To select a measuring tool, click on and select the tool you want
to use.
By default, Measure Line: QGIS measures real distances
between given points according to a defined ellipsoid. You can define a rubberband
color and your preferred measurement units (meters or feet) and angle units
(degrees, radians and gon) in the menu option
Settings ‣ Options ‣ Map Tools.
The tool then allows you to click points on the map. Each segment length,
as well as the total, shows up in the measure window.
To stop measuring, click your right mouse button.
Note that you can interactively change the measurement units in the measurement
dialog. It overrides the Preferred measurement units in the options.
There is an info section in the dialog that shows which CRS settings are being
used during measurement calculations.
Figure Measure 1:
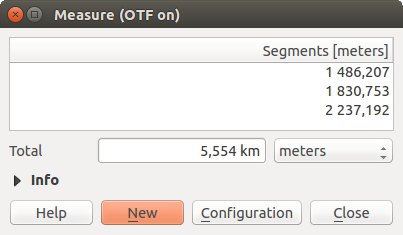
Measure Distance
 Measure Area: Areas can also be measured. In the
measure window, the accumulated area size appears. In addition, the measuring
tool will snap to the currently selected layer, provided that layer has its
snapping tolerance set (see section Setting the Snapping Tolerance and Search Radius). So, if you want
to measure exactly along a line feature, or around a polygon feature, first set
its snapping tolerance, then select the layer. Now, when using the measuring
tools, each mouse click (within the tolerance setting) will snap to that layer.
Measure Area: Areas can also be measured. In the
measure window, the accumulated area size appears. In addition, the measuring
tool will snap to the currently selected layer, provided that layer has its
snapping tolerance set (see section Setting the Snapping Tolerance and Search Radius). So, if you want
to measure exactly along a line feature, or around a polygon feature, first set
its snapping tolerance, then select the layer. Now, when using the measuring
tools, each mouse click (within the tolerance setting) will snap to that layer.
Figure Measure 2:
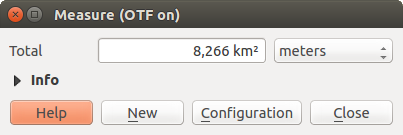
Measure Area
 Measure Angle: You can also measure angles. The
cursor becomes cross-shaped. Click to draw the first segment of the angle you
wish to measure, then move the cursor to draw the desired angle. The measure
is displayed in a pop-up dialog.
Measure Angle: You can also measure angles. The
cursor becomes cross-shaped. Click to draw the first segment of the angle you
wish to measure, then move the cursor to draw the desired angle. The measure
is displayed in a pop-up dialog.
Figure Measure 3:
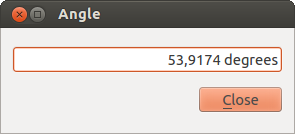
Measure Angle
Pilih dan lepas fitur
The QGIS toolbar provides several tools to select features in the map canvas.
To select one or several features, just click on  and select your
tool:
and select your
tool:
 Select Features by area or single click to
select feature(s) either by simple click or by rectangle
Select Features by area or single click to
select feature(s) either by simple click or by rectangle Select Features by Polygon
 Select Features by Freehand
 Select Features by Radius
To deselect all selected features, click on  Deselect
Features from All Layers.
Deselect
Features from All Layers.
 Select features using an expression allows user
to select features using expression dialog. See Expressions
chapter for some example.
Select features using an expression allows user
to select features using expression dialog. See Expressions
chapter for some example.
Users can save selected features into a New Memory Vector Layer or a New Vector Layer using Edit ‣ Copy Features and Edit ‣ Paste Features as in the wanted format.
Data defined override setup
Beside many options in the vector layer properties dialog or settings in the print
composer, you can find a  Data defined override icon.
Thanks to expressions based on layer attributes or item
settings, prebuild or custom functions and variables,
this tool allows you to set dynamic value for the concerned parameter. When enabled,
the value returned by this widget is applied to the parameter regardless its normal
value (checkbox, textbox, slider...).
Data defined override icon.
Thanks to expressions based on layer attributes or item
settings, prebuild or custom functions and variables,
this tool allows you to set dynamic value for the concerned parameter. When enabled,
the value returned by this widget is applied to the parameter regardless its normal
value (checkbox, textbox, slider...).
Clicking the Data defined override icon shows:
- a Description ... that indicates if it is enabled, which input expected, valid input type and the current definition,
- an entry to list the Field type available,
- an entry to list the Variable available,
- Edit ... button to create or edit the expression to use,
- Paste and Copy buttons,
- Clear button to remove the setup.
Tip
When the data-defined override option is setup correctly the
icon is yellow  or
or  ; if it is broken,
the icon is red
; if it is broken,
the icon is red  or
or  .
.
Parameters that can be used with data-defined tools are:
- Style and symbols parameters
- Labels parameters
- Composer parameters
Fitur Identifikasi
The Identify tool allows you to interact with the map canvas and get information
on features in a pop-up window. To identify features, use View ‣ Identify
features or press Ctrl + Shift + I, or click the  Identify features icon on the Attributes toolbar.
QGIS offers two ways to identify features with the
Identify features tool:
- left click will identify features according to the mode set in the Identify results panel
- right click will fetch all the snapped features from all the visible layers. This will open a context menu, allowing the user to choose more precisely the features to identify.
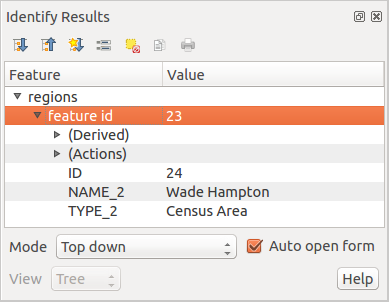
If you click on feature(s), the Identify results dialog will list information about the clicked feature(s). The default view is a tree view where the first item is the name of the layer and its children are its identified feature(s). Each feature is described by the name of a field along with its value. This field is the one set in Properties ‣ Display. Then follows all the other information about the feature.
Jendela ini dapat disesuaikan untuk menampilkan kolom kustom namun secara default akan menampilkan tiga jenis informasi:
- Actions: Actions can be added to the identify feature windows. The action is run by clicking on the action label. By default, only one action is added, namely view feature form for editing. You can define more actions in the layer’s properties dialog.
- Derived: This information is calculated or derived from other information. This includes the feature id, its length or perimeter and area in map units depending on its geometry, the count of spatial parts and the number of the clicked part in case of multi-geometry, the count of vertices in the feature and the number of the closest one to the point clicked. It also reports the X and Y (and Z/M if available) coordinate values of both clicked point and feature closest vertex.
- Data attributes: This is the list of attribute fields and values for the feature that has been clicked.
Figure Identify 1:
Identify features dialog
At the top of the window, you have seven icons:
 Expand tree
 Collapse tree
 Default behavior to define whether next
identified features information should be collapsed or expanded
Default behavior to define whether next
identified features information should be collapsed or expanded View the feature form
- Clear Results
 Copy selected feature to clipboard
 Print selected HTML response
At the bottom of the window, you have the Mode and View comboboxes. With the Mode combobox you can define from which layers features should be identified:
- ‘Current layer’ : only features from the selected layer are identified. The layer may not be visible in the canvas.
- ‘Top down, stop at first’: for only features from the upper visible layer.
- ‘Top down’: for all features from the visible layers. The results are shown in the panel.
- and ‘Layer selection’: opens a context menu where the user selects the layer to identify features from. Operates like a right-click. Only the chosen features will be shown in the result panel.
The View can be set as ‘Tree’, ‘Table’ or ‘Graph’. ‘Table’ and ‘Graph’ views can only be set for raster layers.
The identify tool allows you to auto open a form.
If checked, each time a single feature is identified QGIS will open a form
showing its attributes. This is a handy way to quickly edit a feature’s attributes.
Fungsi lain dapat ditemukan dalam menu konteks dari ditentukannya item. Sebagai contoh, dari menu konteks Anda dapat:
Lihat form fitur
Perbesar ke fitur
Salin fitur: salin semua fitur geometri dan atribut
- Toggle feature selection: Adds identified feature to selection
Salin nilai atribut: hanya menyalin nilai dari atribut yang Anda klik
- Copy feature attributes: Copy the attributes of the feature
Bersihkan hasilnya: Hapus hasil di jendela
Bersihkan highlight: Hapus fitur highlight pada peta
Highlight semua
Highlight lapisan
Aktifkan lapisan: Pilih lapisan yang akan diaktifkan
Properti lapisa: buka jendel properti lapisan
Perluas (expand) semua
Runtuh (collapse) semua
Peralatan Anotasi
The  Text Annotation tool in the attribute
toolbar provides the possibility to place formatted text in a balloon on the
QGIS map canvas. Use the Text Annotation tool and click into the
map canvas.
Text Annotation tool in the attribute
toolbar provides the possibility to place formatted text in a balloon on the
QGIS map canvas. Use the Text Annotation tool and click into the
map canvas.
Figure annotation 1:

Annotation text dialog
Dobel klik pada item membuka dialog dengan berbagai pilihan. Ada editor teks untuk memasukkan teks yang diformat dan pengaturan item lain. Misalnya ada pilihan memiliki item ditempatkan pada posisi peta (ditampilkan dengan simbol penanda) atau memiliki item pada posisi layar (tidak berhubungan dengan peta). Item ini bisa dipindahkan dengan posisi peta (geser penanda peta) atau hanya dengan memindahkan balon. Ikon adalah bagian dari tema GIS, dan digunakan secara default dalam tema-tema lain juga.
The  Move Annotation tool allows you to move the
annotation on the map canvas.
Move Annotation tool allows you to move the
annotation on the map canvas.
Anotasi HTML
The  Html Annotation tools in the attribute
toolbar provides the possibility to place the content of an html file in a
balloon on the QGIS map canvas. Using the Html Annotation tool,
click into the map canvas and add the path to the html file into the dialog.
Html Annotation tools in the attribute
toolbar provides the possibility to place the content of an html file in a
balloon on the QGIS map canvas. Using the Html Annotation tool,
click into the map canvas and add the path to the html file into the dialog.
Anotasi SVG
The  SVG Annotation tool in the attribute toolbar
provides the possibility to place an SVG symbol in a balloon on the QGIS map
canvas. Using the SVG Annotation tool, click into the map canvas and
add the path to the SVG file into the dialog.
SVG Annotation tool in the attribute toolbar
provides the possibility to place an SVG symbol in a balloon on the QGIS map
canvas. Using the SVG Annotation tool, click into the map canvas and
add the path to the SVG file into the dialog.
Form anotasi
Additionally, you can also create your own annotation forms. The
Form Annotation tool is useful to display
attributes of a vector layer in a customized Qt Designer form (see
figure_custom_annotation). This is similar to the designer forms for the
Identify features tool, but displayed in an annotation item.
Also see this video https://youtu.be/0pDBuSbQ02o?t=2m25s from
Tim Sutton for more information.
Figure annotation 2:
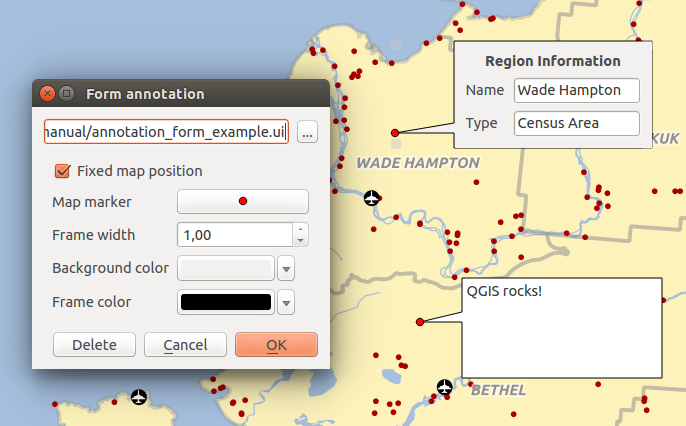
Customized qt designer annotation form
Catatan
Jika Anda menekan Ctrl+T sementara alat Anotasi aktif (anotasi bergerak, anotasi teks, form anotasi), visibilitas item yang terbalik.
Bookmark Spasial
Spatial Bookmarks allow you to “bookmark” a geographic location and return to it later. Bookmarks are saved on the computer, meaning that they are available from any project in the same computer.
Membuat Bookmark
Membuat Bookmark
Perbesar atau geser ke interes area.
- Select the menu option View ‣ New Bookmark or press Ctrl-B. The Spatial Bookmark panel opens with the newly created bookmark.
Masukkan nama deskripsi dari bookmark (batas 255 karakter).
- Press Enter to add the bookmark or click elsewhere.
Catatan Anda bisa memiliki bookmark banyak dengan satu nama.
Bekerja dengan Bookmark
To use or manage bookmarks, select the menu option View ‣ Show Bookmarks. The Spatial Bookmarks panel allows you to:
- Zoom to a Bookmark: select the desired bookmark and then click Zoom To Bookmark. You can also zoom to a bookmark by double-clicking on it.
- Delete a Bookmark: select the bookmark and click Delete Bookmark. Confirm your choice.
- Import or Export a bookmark: To share or transfer your bookmarks between computers you can use the Import/Export Bookmarks pull down menu in the Spatial Bookmarks dialog. All the bookmarks are transferred.
Proyek-proyek Nesting
Jika Anda ingin menanamkan (embed) isi dari berkas proyek lain kedalam proyek Anda, Anda bisa memilih Lapisan ‣ Tanam Lapisan dan Grup.
Menanam (Embedding) lapisan
Dialog berikut memungkinkan Anda menanamkan lapisan dari proyek-proyek lain. Berikut ini adalah contoh kecil:
- Press
 to look for a project from the Alaska dataset.
 - Select the project file relations.qgs. You can see the content of the project (see figure_embed_dialog).
- Press Ctrl and click on the layers airports and regions. Press [OK]. The selected layers are embedded in the map legend and the map view now.
Figure Nesting 1:

Select layers and groups to embed
Sementara lapisan tertanam dapat diedit, Anda tidak dapat mengubah properti mereka seperti gaya dan pelabelan.
Menghapus lapisan-lapisan ditanam (embdded)
Right-click on the embedded layer and choose  Remove.
Dekorasi
The Decorations of QGIS include the Grid, the Copyright Label, the North Arrow and the Scale Bar. They are used to ‘decorate’ the map by adding cartographic elements.
Kisi (Grid)
 Grid memungkinkan untuk menambahkan koordinat kisi (grid) dan koordinat anotasi untuk kanvas peta.
Figure Decorations 1:
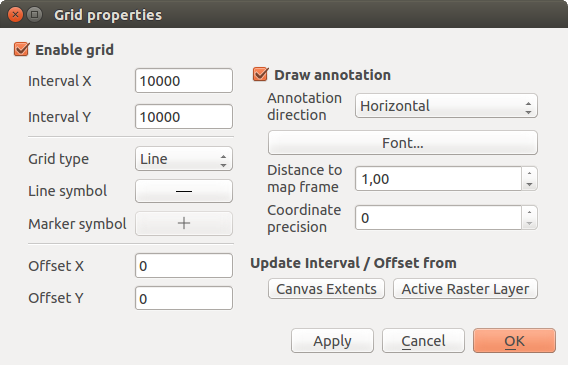
The Grid Dialog
Pilih dari menu Tampilan ‣ Decorasi ‣ Kisi. Mulai dialog (lihat figure_decorations_1).
Aktifkan kotak centang
Aktifkan Kisi dan menetapkan definisi kisi (grid) sesuai dengan lapisan yang dimuat dalam kanvas peta.Aktifkan kotak centang Gambar anotasi dan menetapkan definisi anotasi sesuai dengan lapisan yang dimuat dalam kanvas peta.
- Click [Apply] to verify that it looks as expected or [OK] if you’re satisfied.
Label Hak Cipta
 Copyright label adds a copyright label using the text
you prefer to the map.
Copyright label adds a copyright label using the text
you prefer to the map.
Figure Decorations 2:
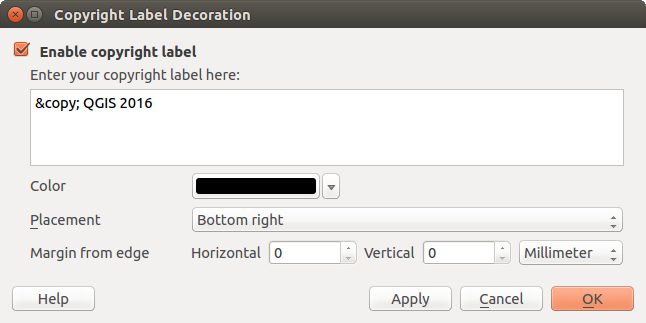
The Copyright Dialog
Pilih dari menu Tampilan ‣ Dekorasi ‣ Label hak Cipta. (lihat figure_decorations_2).
Pastikan kotak centang telah ditandai/aktifkan Aktifkan Label Hak Cipta
Masukkan teks yang Anda ingin tempatkan di peta. Anda bisa menggunakan HTML seperti dalam contoh
- Choose the placement of the label from the Placement
 combo box.
 - You can refine the placement of the item by setting a Horizontal and/or Vertical Marging from (Canvas) Edge. These values can be a distance in Millimeter or Pixels or set as Percentage of the width or height of the map canvas.
- You can change the color to apply.
- Click [Apply] to verify that it looks as expected or [OK] if you’re satisfied.
In the example above, which is the default, QGIS places a copyright symbol followed by the date in the lower right-hand corner of the map canvas.
Panah Utara
![]() North Arrow places a simple north arrow on the map canvas.
Currently, there is only one style available. You can adjust the angle of the
arrow or let QGIS set the direction automatically.
If you choose to let QGIS determine the direction, it makes its best guess
as to how the arrow should be oriented.
For placement of the arrow, you have four options, corresponding to
the four corners of the map canvas.
You can refine the placement of the arrow by setting a Horizontal and/or Vertical
Marging from (Canvas) Edge. These values can be a distance in Millimeter or
Pixels or set as Percentage of the width or height of the map canvas.
North Arrow places a simple north arrow on the map canvas.
Currently, there is only one style available. You can adjust the angle of the
arrow or let QGIS set the direction automatically.
If you choose to let QGIS determine the direction, it makes its best guess
as to how the arrow should be oriented.
For placement of the arrow, you have four options, corresponding to
the four corners of the map canvas.
You can refine the placement of the arrow by setting a Horizontal and/or Vertical
Marging from (Canvas) Edge. These values can be a distance in Millimeter or
Pixels or set as Percentage of the width or height of the map canvas.
Figure Decorations 3:
The North Arrow Dialog
Bar Skala
 Scale Bar adds a simple scale bar to the map canvas. You
can control the style and placement, as well as the labelling of the bar.
Scale Bar adds a simple scale bar to the map canvas. You
can control the style and placement, as well as the labelling of the bar.
Figure Decorations 4:
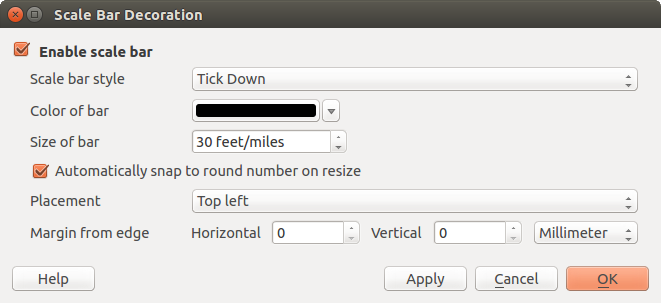
The Scale Bar Dialog
QGIS only supports displaying the scale in the same units as your map frame. So if the units of your layers are in meters, you can’t create a scale bar in feet. Likewise, if you are using decimal degrees, you can’t create a scale bar to display distance in meters.
Menambahkan bar skala:
Pilih dari menu Tampilan ‣ Dekorasi ‣ Skala Bar (lihat figure_decorations_4)
Pastikan kotak centang sudah aktif
Aktifkan skala bar- Choose the style from the Scale bar style
combo box.
- Select the color for the bar Color of bar or use
the default black color.
- Set the Size of bar
 .
. - Optionally, check Automatically snap to round number
on resize to display values easy-to-read.
- Choose the placement from the Placement combo box.
- You can refine the placement of the item by setting a Horizontal and/or Vertical Marging from (Canvas) Edge. These values can be a distance in Millimeter or Pixels or set as Percentage of the width or height of the map canvas.
- Click [Apply] to verify that it looks as expected or [OK] if you’re satisfied.
Tip
Pengaturan Dekorasi
Saat Anda menyimpan sebuah proyek .qgs, setiap perubahan yang Anda buat pada Kisi (Grid), Panah Utara, Skala Bar dan Hak Cipta akan disimpan dalam proyek dan dikembalikan pada saat Anda memuat proyek.
Authentication
QGIS has facility to store/retrieve authentication credentials in a secure manner. Users can securely save credentials into authentication configurations, which are stored in a portable database, can be applied to server or database connections, and safely referenced by their ID tokens in project or settings files. For more information see Authentication System.
A master password needs to be set up when initializing the authentication system and its portable database.
Save layer into file
Layers (raster or vector) can be saved in another format with the Save As... feature in the layer contextual menu (by right-clicking in the layer in the layer tree) or in the Layer ‣ Save As... menu.
The Save As dialog shows several parameters to change the behaviour when saving the layer. Common parameters (raster and vector) are:
- Format
- Filename
- CRS
- Add save file to map to add the new layer to the canvas
- Extent (possible values are layer, Map view or custom extent)
- Create (for raster), Layer or Custom (for vector) Options which allow you to change some advanced options. Advanced user can see the driver documentation in gdal-ogr documentation.
However, some parameters are specific to raster and vector formats:
- Raster specific parameters:
- Resolution (horizontal and vertical)
- Pyramid creation
- Output mode (raw data or rendered image)
- Vector specific parameters:
- Encoding
- Save only selected features
- Skip attribute creation
- Symbology export: can be used mainly for DXF export and for all file
formats who manage OGR feature styles (see note below) as DXF, KML, tab
file formats:
- No symbology: default style of the application that reads the data
- Feature symbology: save style with OGR Feature Styles (see note below)
- Symbol Layer symbology: save with OGR Feature Styles (see note below) but export the same geometry multiple times if there are multiple symbology symbol layers used
- Geometry:
- force to multi-geometry,
- add z-dimension,
- add or remove a geometry column with the drop-down list. This is not linked with the current geometry type of the layer. You can add an empty geometry column to an attribute table, remove the geometry column of a spatial layer.
Catatan
OGR Feature Styles are a way to store style directly in the data as a hidden attribute. Only some format can handle this kind of information. KML, DXF and TAB files format are such format. For advanced user, you can read the OGR Feature Styles specification document.
Catatan
About DXF files
Vector layers can be exported to DXF files using another tool, the DXF Export ... in Project. The windows allow the user to choose the layer file, the symbology mode (see the note above), the symbology scale, the encoding, the visibility preset and the layers to include in the DXF file.
As an option, you can Use the layer title as name if
set or Export features intersecting the current map extent.
Use of variables for dynamic content
You can define custom variables for use in expressions. Variables can be defined at the application global level, project level, layer level and composition level. Just like CSS cascading rules, variables can be overwritten - eg, a project level variable will overwrite any application level variables set. You can use these variables to build text strings or other custom expressions using @ character before the variable name. For example in composer creating a label with this content:
This map was made using QGIS [% @qgis_version %]. The project file for this
map is: [% @project_path %]
Will render the label like this:
This map was made using QGIS 2.14. The project file for this map is:
/gis/qgis-user-conference-2015.qgs
You can manage global variables from the Settings ‣ Options menu, and project level variables from Project properties (including adding your own custom variables).
Figure Variables dialog 2:

Edit variable at the project level
Catatan
you can read more information and find examples here Exploring variables in QGIS 2.12, part 1, part 2 and part 3.