3.2. Lesson: Simbologia
Simbolistica unui strat reprezintă aspectul său vizual pe hartă. Abilitățile de bază ale GIS, comparativ cu alte moduri de reprezentare a datelor cu aspecte spațiale, constă în faptul că, în GIS, aveți o reprezentare vizuală dinamică a datelor cu care lucrați.
Prin urmare, aspectul vizual al hărții (care depinde de simbolistica straturilor individuale) este foarte important. Utilizatorul final a hărților pe care le produceți, va trebui să fie capabil de a înțelege cu ușurință ceea ce reprezintă harta. La fel de important, dvs. trebuie să fiți în măsură să explorați datele cu care lucrați, iar o bună simbolistică ajută foarte mult.
Cu alte cuvinte, a avea propria simbologie nu reprezintă un lux sau doar o noțiune frumoasă. De fapt, este esențial să utilizați un GIS în mod corespunzător, pentru a produce hărți și informații pe care oamenii să le poată folosi.
Scopul acestei lecții: De a putea crea simbolistica dorită pentru orice strat vectorial.
3.2.1.  Follow Along: Schimbarea Culorilor
Pentru a schimba simbolistica unui strat, deschideți Layer Properties. Să începem prin schimbarea culorii stratului landuse.
Clic-dreapta pe stratul landuse din Lista straturilor.
Selectați elementul Properties din meniul care apare.
Note
De asemenea, în mod implicit, puteți accesa proprietățile unui strat făcând un dublu clic pe acesta, în lista Straturilor.
În fereastra Properties:
Selectați fila Style, din extrema stângă:
Clic pe butonul de selectare a culorii, de lângă eticheta Color.
Va apărea un dialog standard pentru culoare.
Alegeți o culoare gri, apoi faceți clic pe OK.
Clic iarăși pe OK din fereastra Layer Properties, apoi veți vedea schimbarea de culoare asupra stratului.
3.2.3. Follow Along: Schimbă Structura Simbolului
This is good stuff so far, but there’s more to a layer’s symbology than just its color. Next we want to eliminate the lines between the different land use areas so as to make the map less visually cluttered.
Deschideți fereastra Proprietăților Stratului pentru stratul landuse.
Under the Style tab, you will see the same kind of dialog as before. This time, however, you’re doing more than just quickly changing the color.
- In the Symbol Layers panel, expand the Fill dropdown (if necessary) and select the Simple fill option:
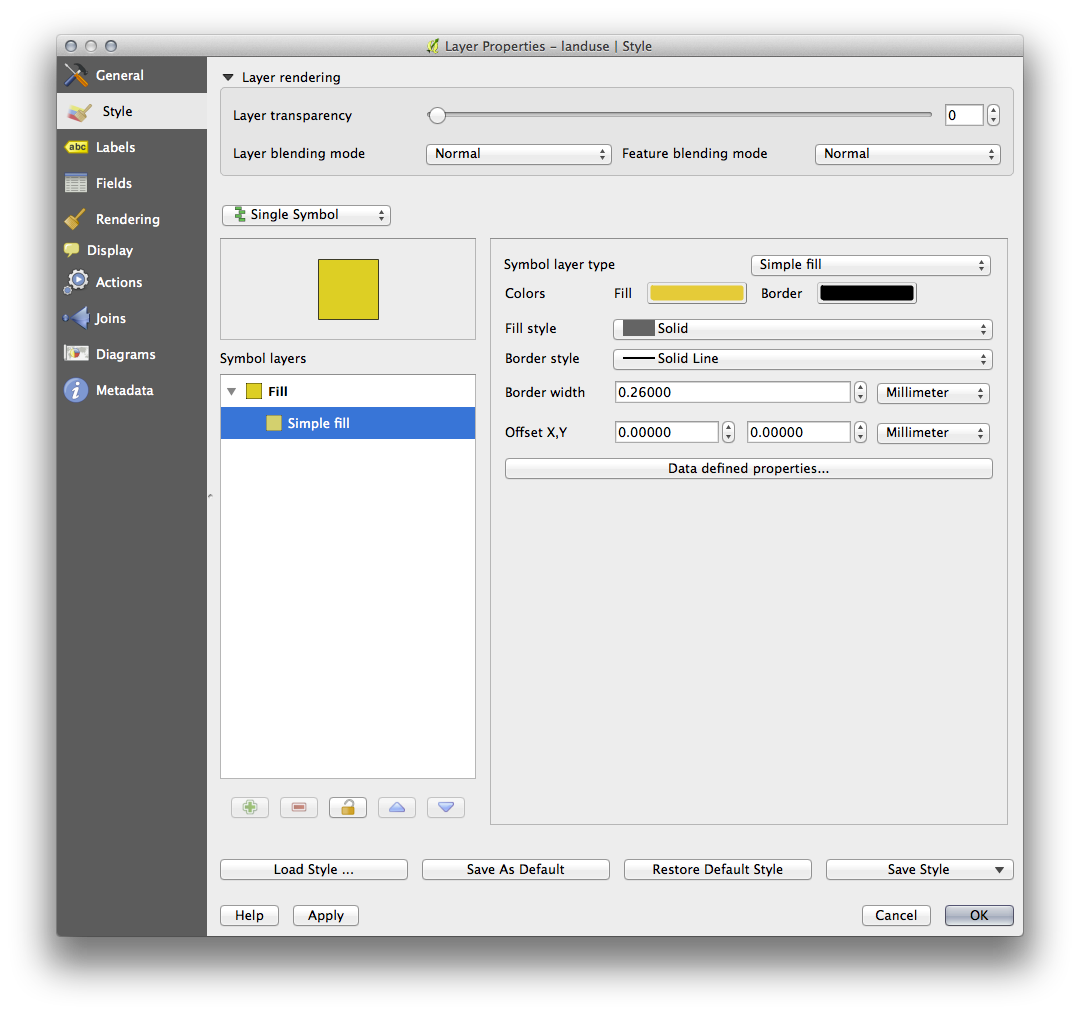
Clic pe caseta Border style. În momentul de față, ar trebui să vedeți o linie scurtă și cuvintele Solid Line.
Schimbați-o pe No Pen.
Clic pe OK
Acum, stratul landuse nu va avea nici o linie între arii.
3.2.4. Try Yourself
Schimbați iarăși simbolistica stratului water, pentr a avea un contur albastru mai închis.
Schimbați simbolistica stratului rivers, într-o reprezentare mai sensibilă a căilor de apă
3.2.5.  Follow Along: Vizibilitate în funcţie de scară
Sometimes you will find that a layer is not suitable for a given scale. For example, a dataset of all the continents may have low detail, and not be very accurate at street level. When that happens, you want to be able to hide the dataset at inappropriate scales.
În cazul nostru, am putea decide să ascundem clădirile din vizualizările la scări mici. Această hartă, de exemplu ...
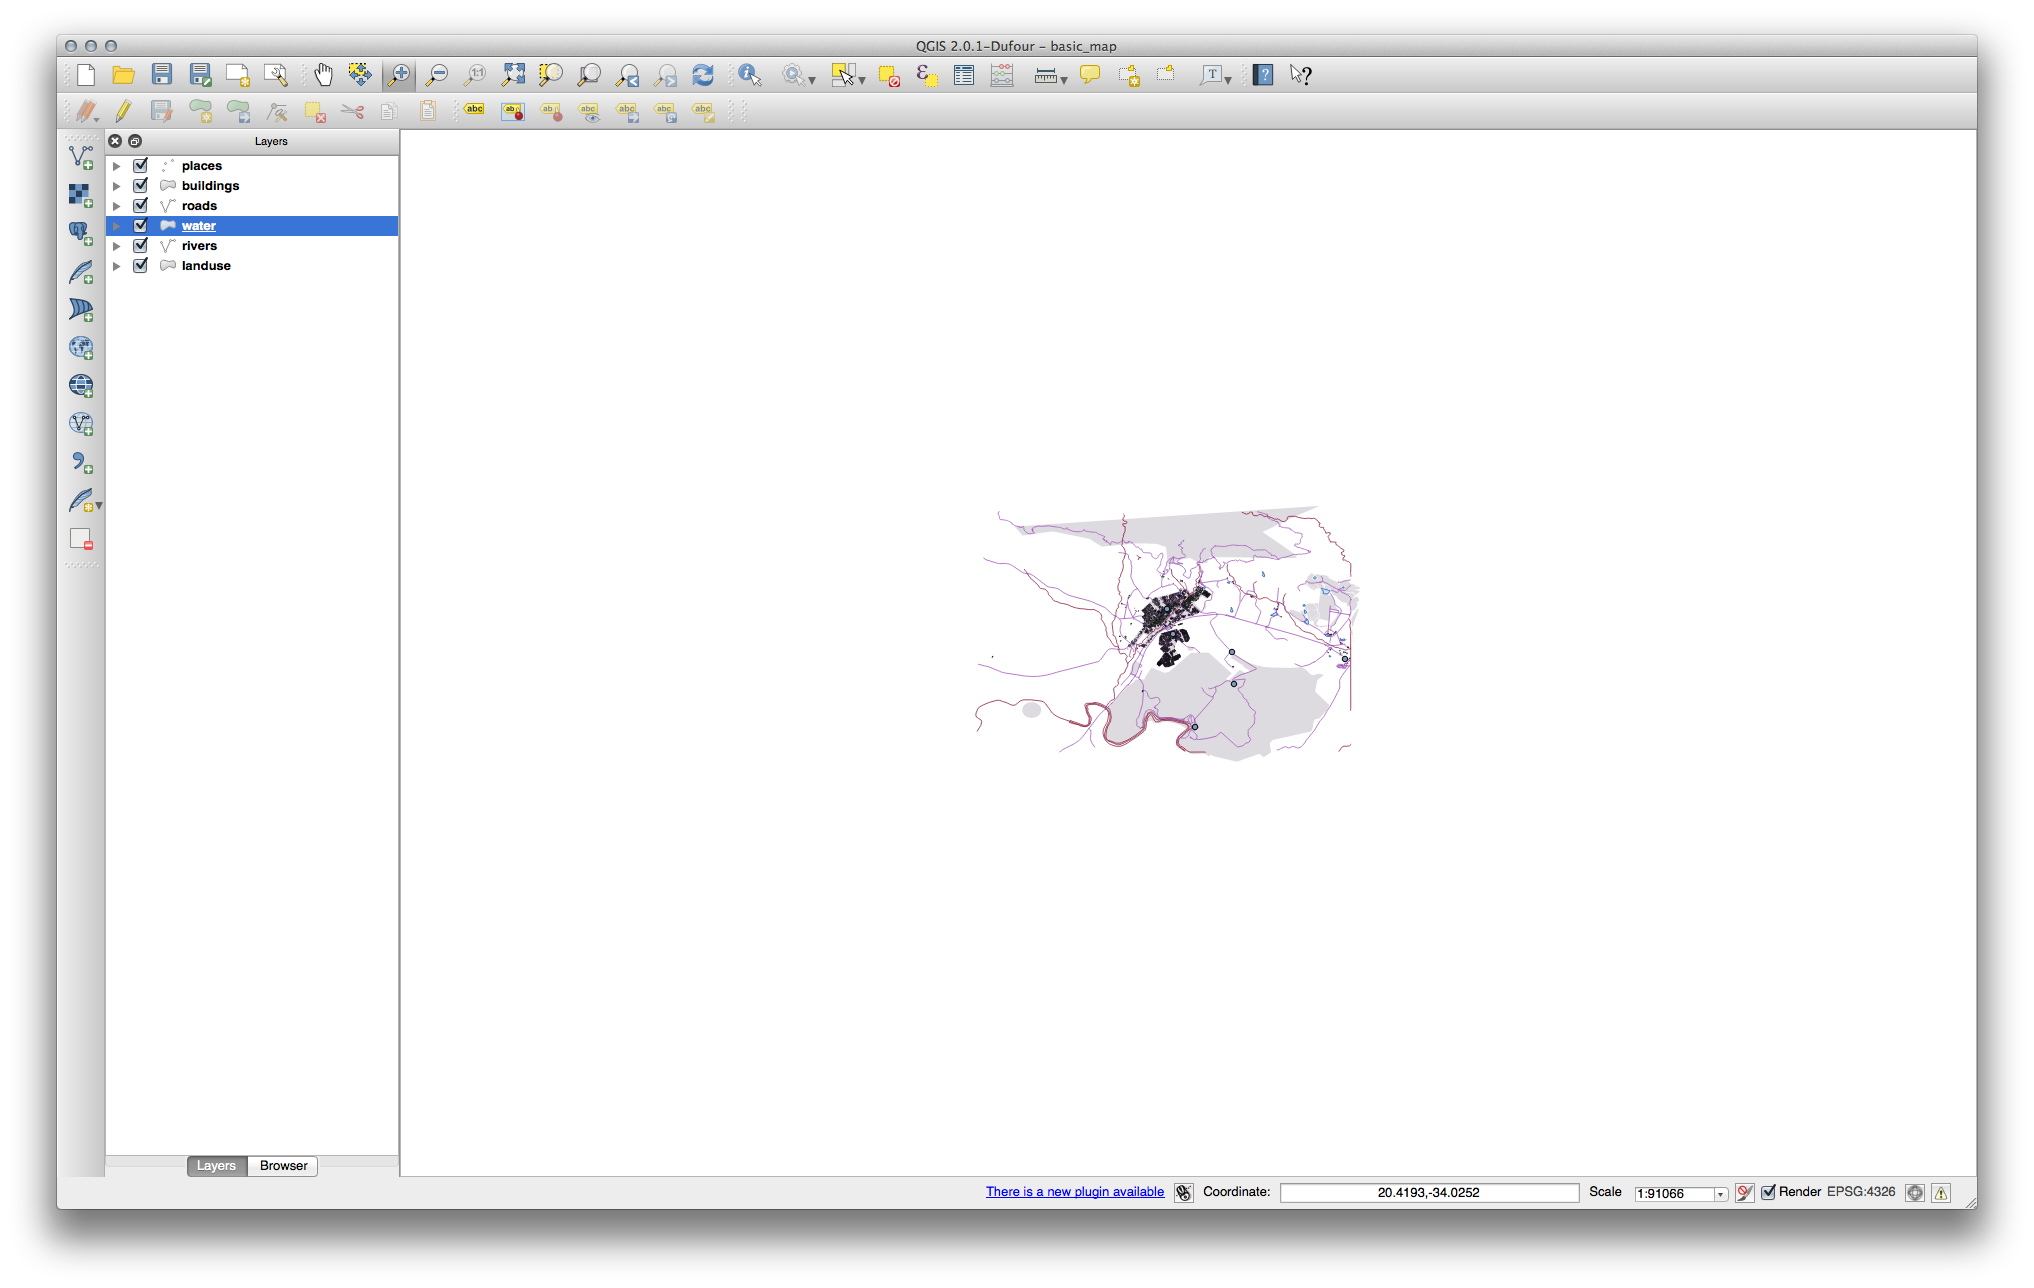
... nu este foarte utilă. Clădirile sunt greu de distins la acea scară.
Pentru a activa randarea în funcţie de scară:
Deschideți dialogul Proprietăților Stratului pentru stratul buildings.
Activați fila General.
- Enable scale-based rendering by clicking on the checkbox labelled Scale dependent visibility:
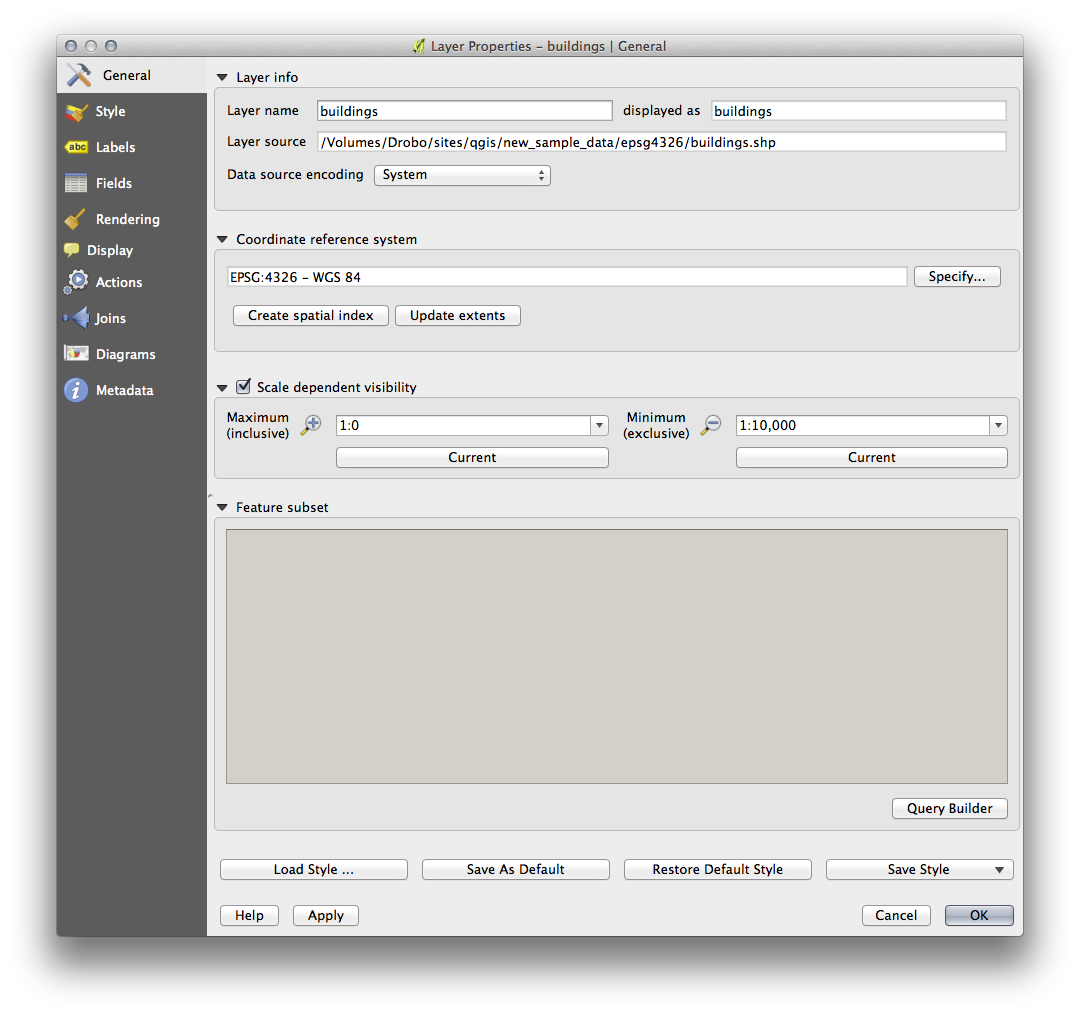
Schimbați valoarea Minimă la 1:10,000.
Clic pe OK
Test the effects of this by zooming in and out in your map, noting when the buildings layer disappears and reappears.
Note
You can use your mouse wheel to zoom in increments. Alternatively, use the zoom tools to zoom to a window:


3.2.6. Follow Along: Adăugarea Straturilor Simbolului
Now that you know how to change simple symbology for layers, the next step is to create more complex symbology. QGIS allows you to do this using symbol layers.
- Go back to the landuse layer’s symbol properties panel (by clicking Simple fill in the Symbol layers panel).
In this example, the current symbol has no outline (i.e., it uses the No Pen border style).
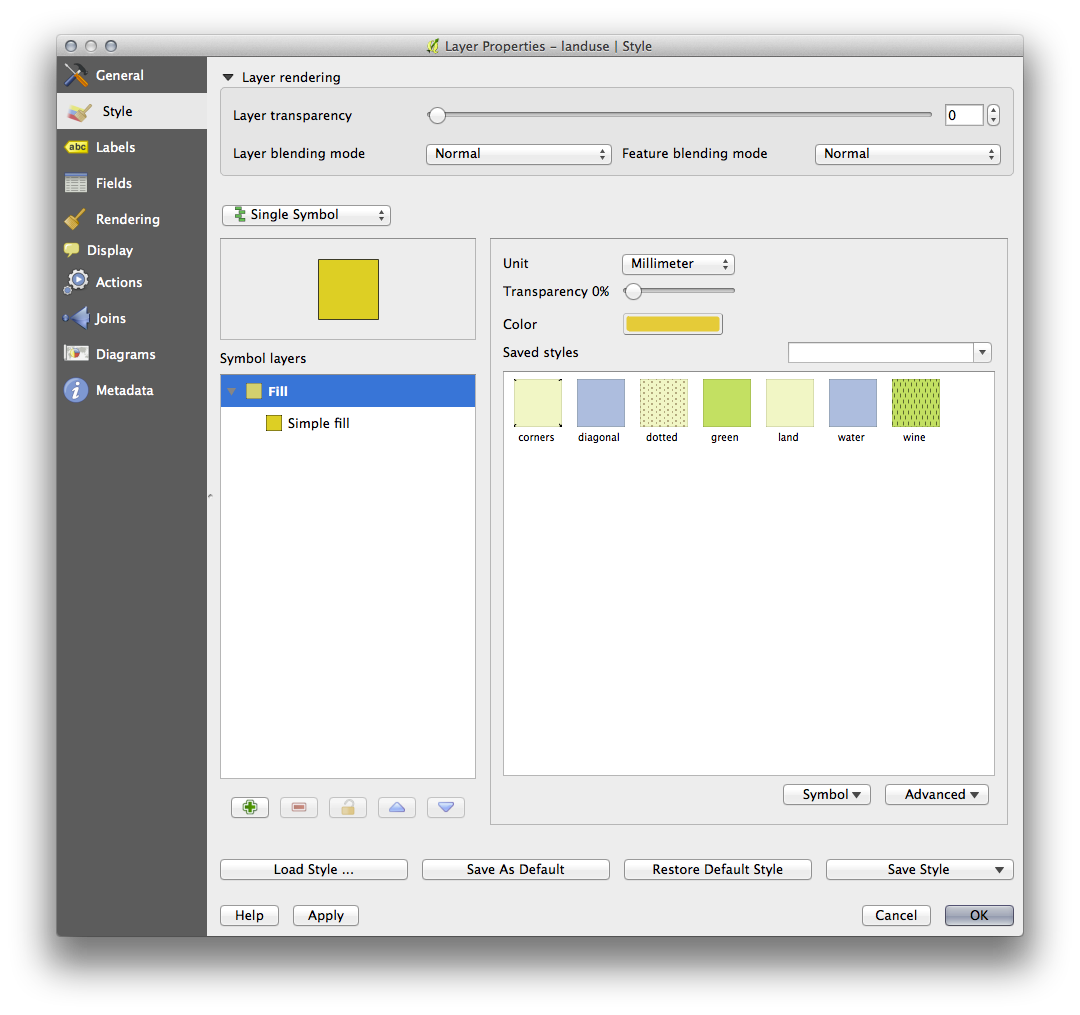
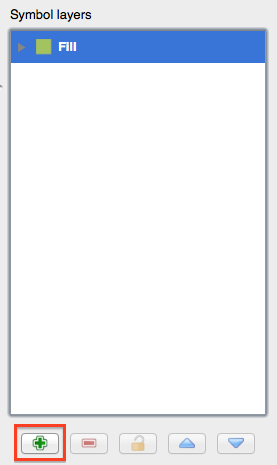
Select the Fill in the Symbol layers panel. Then click the Add symbol layer button:
Faceți clic pe el, apoi dialogul se va schimba, arătând oarecum ca aceasta:
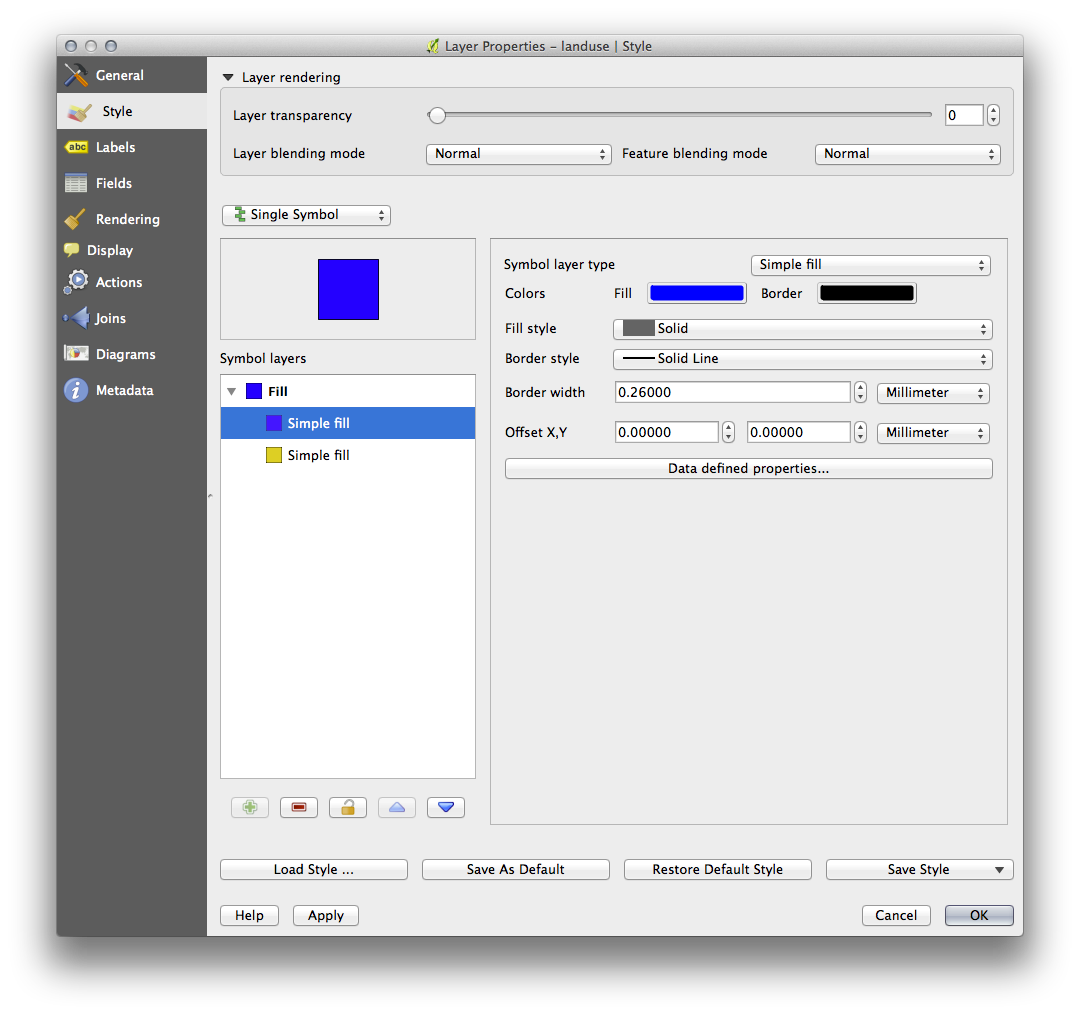
(Poate apărea, oarecum, în culori diferite, dar ne vom ocupa curând de acest aspect.)
Now there’s a second symbol layer. Being a solid color, it will of course completely hide the previous kind of symbol. Plus, it has a Solid Line border style, which we don’t want. Clearly this symbol has to be changed.
Note
It’s important not to get confused between a map layer and a symbol layer. A map layer is a vector (or raster) that has been loaded into the map. A symbol layer is part of the symbol used to represent a map layer. This course will usually refer to a map layer as just a layer, but a symbol layer will always be called a symbol layer, to prevent confusion.
Având noul strat Simple Fill selectat:
Setați stilul bordurii la No Pen, ca mai înainte.
- Change the fill style to something other than Solid or No brush. For example:
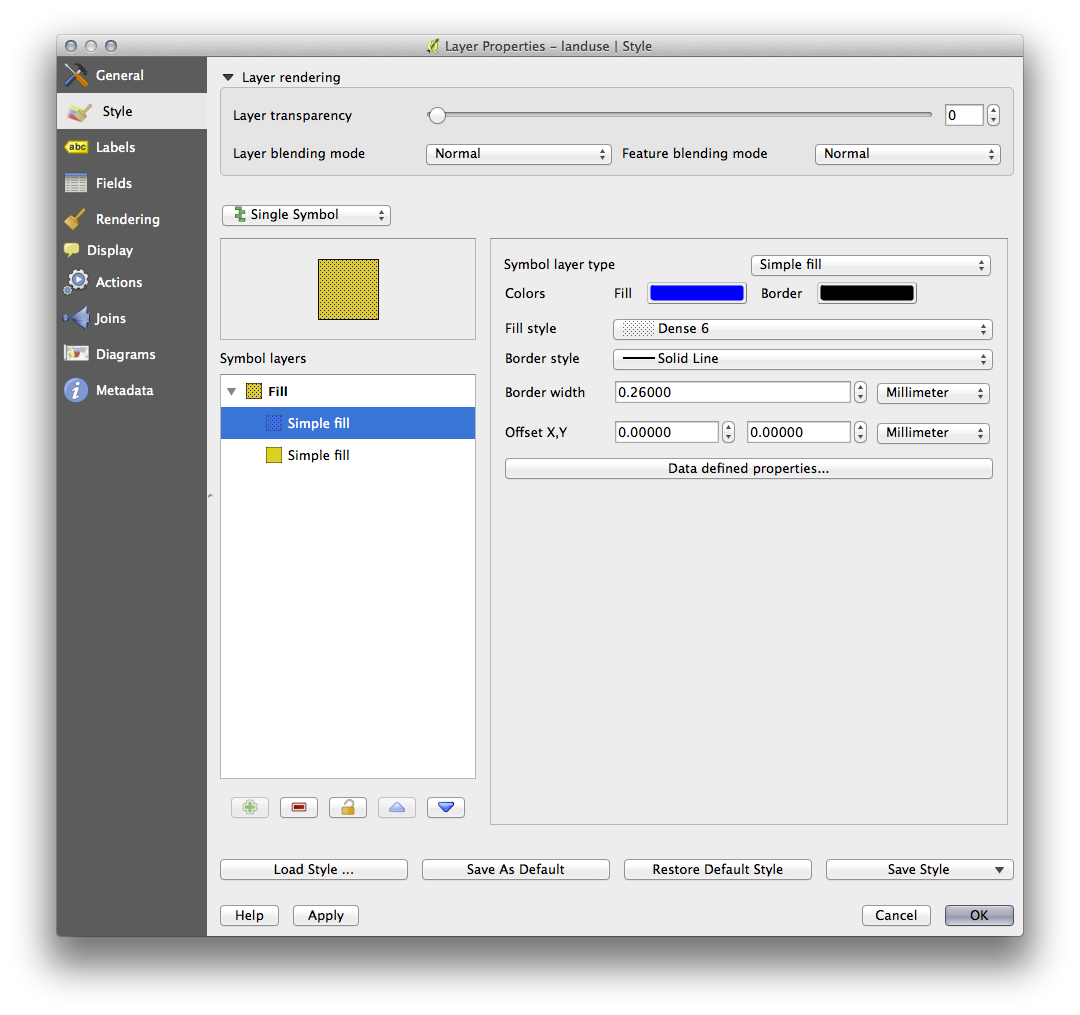
- Click OK. Now you can see your results and tweak them as needed.
You can even add multiple extra symbol layers and create a kind of texture for your layer that way.
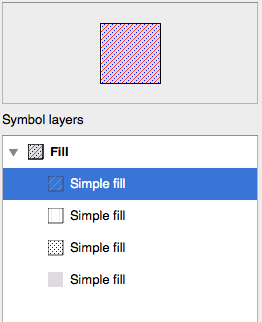
It’s fun! But it probably has too many colors to use in a real map...
3.2.7. Try Yourself
- Remembering to zoom in if necessary, create a simple, but not distracting texture for the buildings layer using the methods above.
3.2.8. Follow Along: Ordonarea Nivelurilor Simbolului
When symbol layers are rendered, they are also rendered in a sequence, similar to the way the different map layers are rendered. This means that in some cases, having many symbol layers in one symbol can cause unexpected results.
- Give the roads layer an extra symbol layer (using the method for adding symbol layers demonstrated above).
- Give the base line a Pen width of 0.3, a white color and select Dashed Line from the Pen Style dropdown.
- Give the new, uppermost layer a thickness of 1.3 and ensure that it is a Solid Line.
Veți observa că se întâmplă acest lucru:
Ei bine, asta nu e ceea ce ne dorim, deloc!
To prevent this from happening, you can sort the symbol levels and thereby control the order in which the different symbol layers are rendered.
To change the order of the symbol layers, select the Line layer in the Symbol layers panel, then click Advanced –> Symbol levels... in the bottom right-hand corner of the window. This will open a dialog like this:
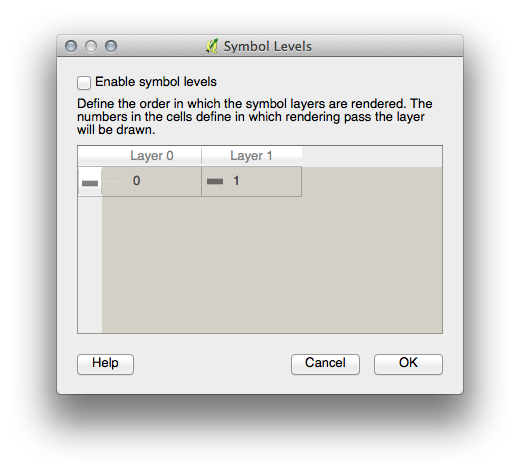
Select Enable symbol levels. You can then set the layer ordering of each symbol by entering the corresponding level number. 0 is the bottom layer.
În cazul nostru, vrem să inversăm ordinea, în acest fel:
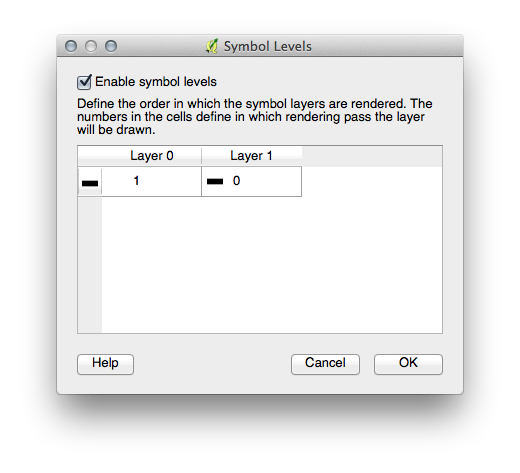
Acest render va desena punctată, linia albă de deasupra liniei groase și negre.
Faceți clic pe Ok pentru a reveni la hartă.
Harta va arăta acum în modul următor:

Also note that the meeting points of roads are now “merged”, so that one road is not rendered above another.
When you’re done, remember to save the symbol itself so as not to lose your work if you change the symbol again in the future. You can save your current symbol style by clicking the Save Style ... button under the Style tab of the Layer Properties dialog. Generally, you should save as QGIS Layer Style File.
Save your style under exercise_data/styles. You can load a previously saved style at any time by clicking the Load Style ... button. Before you change a style, keep in mind that any unsaved style you are replacing will be lost.
3.2.9. Try Yourself
Schimbați iarăși aspectul stratului roads.
The roads must be narrow and mid-gray, with a thin, pale yellow outline. Remember that you may need to change the layer rendering order via the Advanced ‣ Symbol levels... dialog.
3.2.10.  Try Yourself
Symbol levels also work for classified layers (i.e., layers having multiple symbols). Since we haven’t covered classification yet, you will work with some rudimentary pre-classified data.
Creați o nouă hartă și adăugați doar setul de date roads.
Aplicați stilul advanced_levels_demo.qml furnizat în exercise_data/styles.
Focalizați în aria Swellendam.
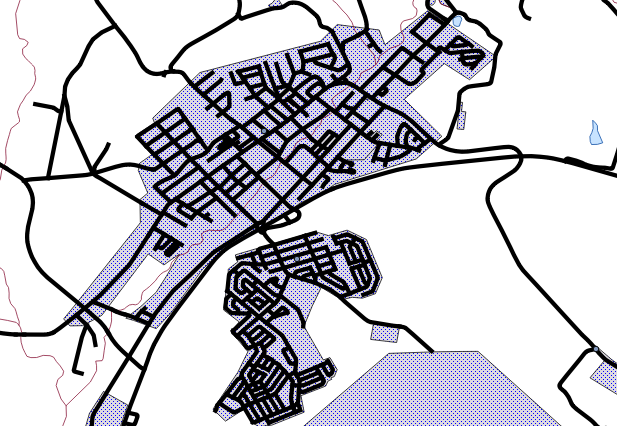
- Using symbol layers, ensure that the outlines of layers flow into one another as per the image below:
3.2.11. Follow Along: Tipurile de straturi ale simbolului
In addition to setting fill colors and using predefined patterns, you can use different symbol layer types entirely. The only type we’ve been using up to now was the Simple Fill type. The more advanced symbol layer types allow you to customize your symbols even further.
Each type of vector (point, line and polygon) has its own set of symbol layer types. First we will look at the types available for points.
3.2.11.1. Tipurile de Straturi pentru Simbolurile de tip Punct
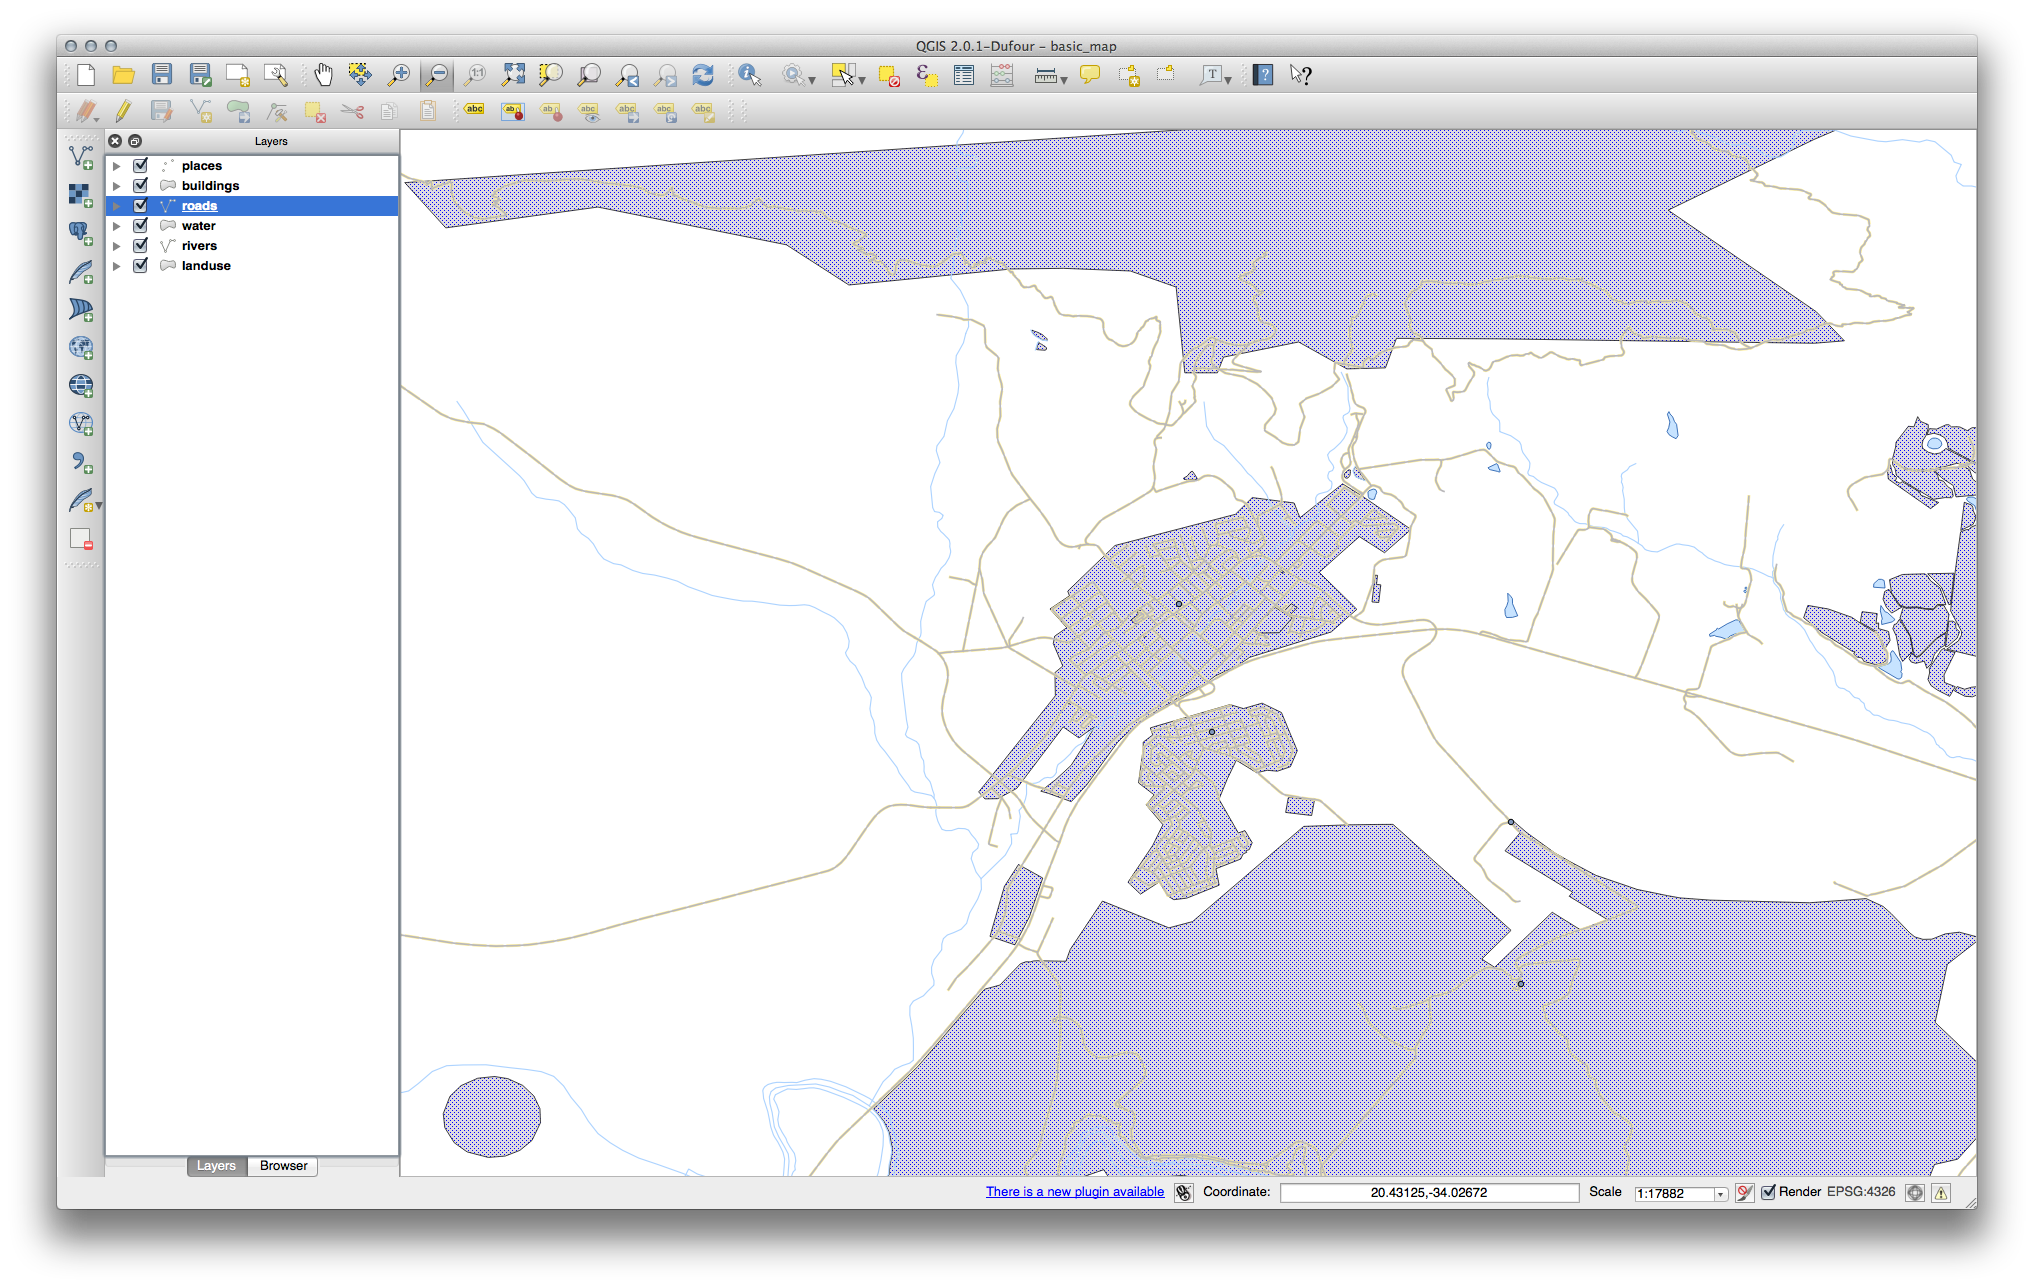
Deschideți proiectul dvs. basic_map.
Modificați proprietățile simbolului pentru stratul places:
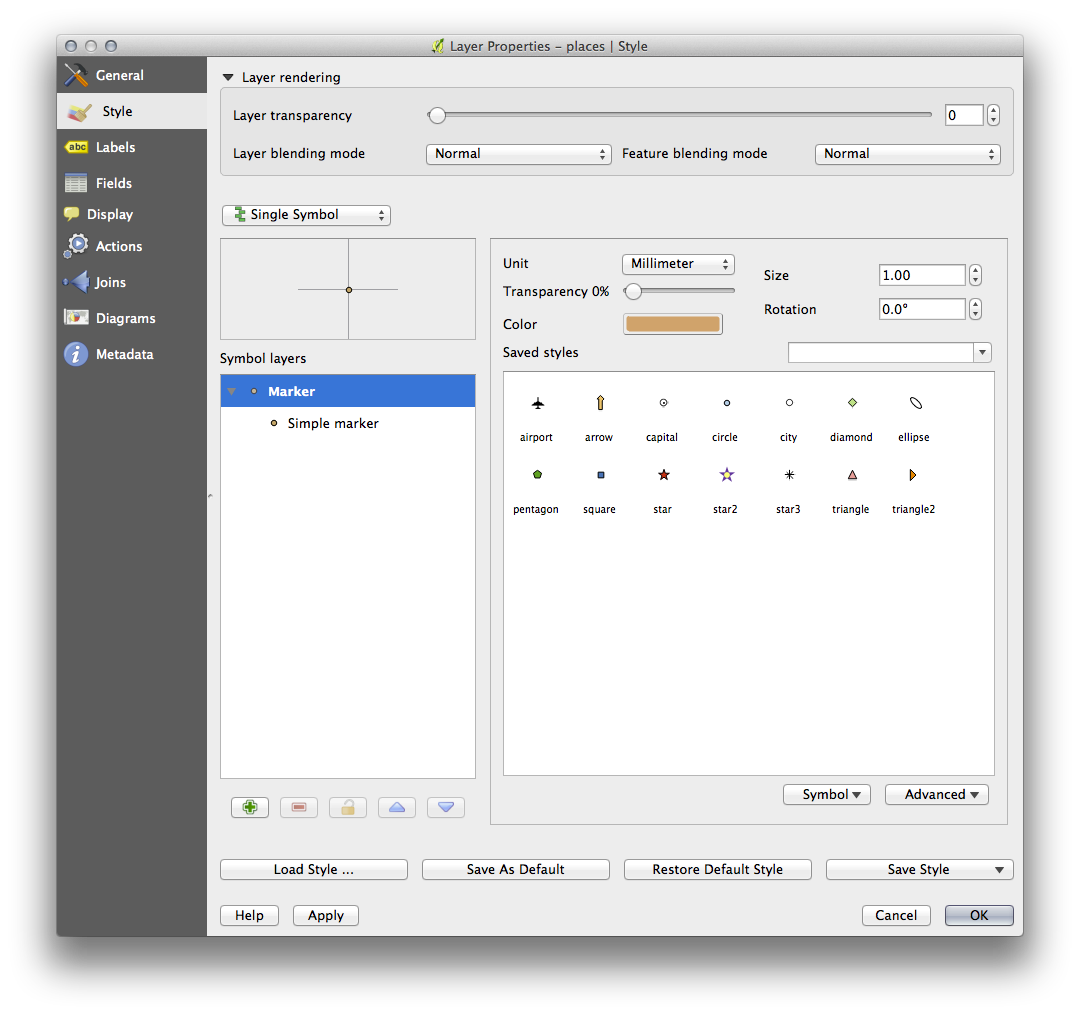
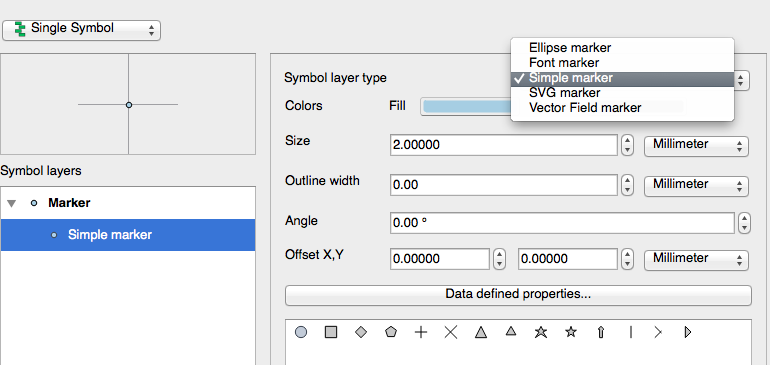
- You can access the various symbol layer types by selecting the Simple marker layer in the Symbol layers panel, then click the Symbol layer type dropdown:
- Investigate the various options available to you, and choose a symbol with styling you think is appropriate.
- If in doubt, use a round Simple marker with a white border and pale green fill, with a size of 3,00 and an Outline width of 0.5.
3.2.11.2. Tipurile de Straturi pentru Simbolurile de tip Linie
Pentru a vedea diferitele opțiuni disponibile pentru datele de tip linie:
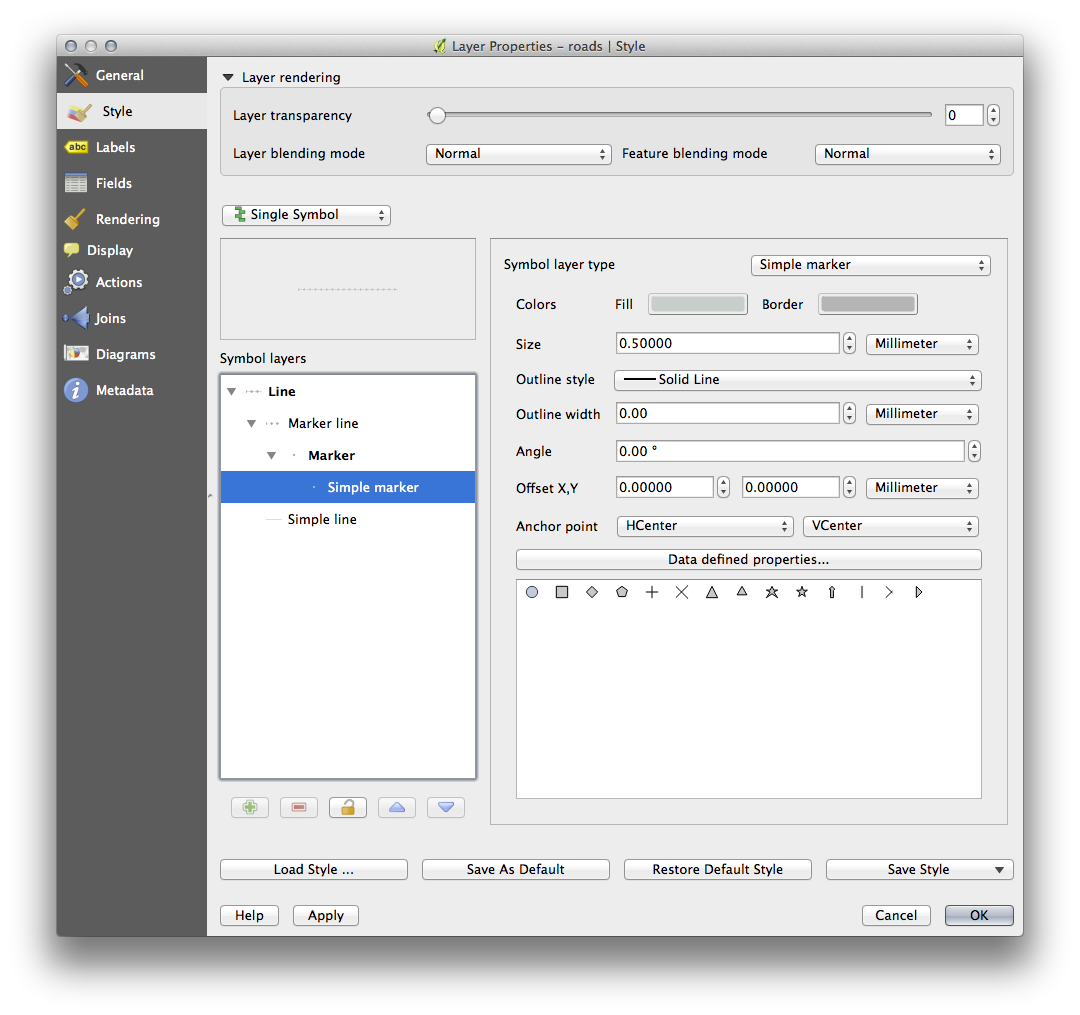
- Change the symbol layer type for the roads layer’s topmost symbol layer to Marker line:
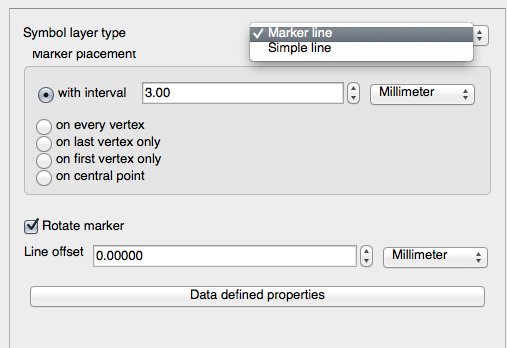
- Select the Simple marker layer in the Symbol layers panel. Change the symbol properties to match this dialog:
Schimbați intervalul la 1,00:
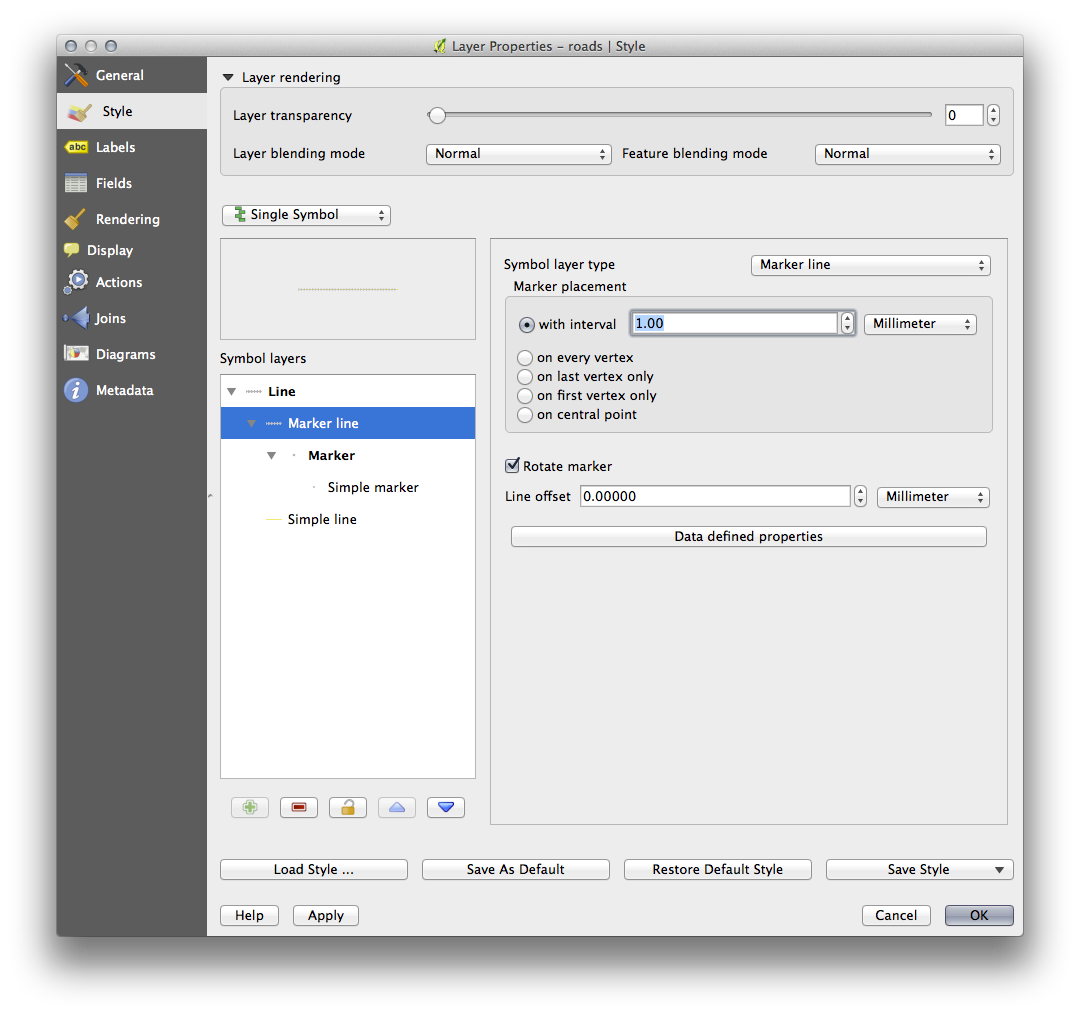
Asigurați-vă că nivelurile simbolurilor sunt corecte (prin intermediul dialogului pe care l-am folosit mai devreme Avansat –> Nivelurile Simbolurilor) înainte de aplicarea stilului.
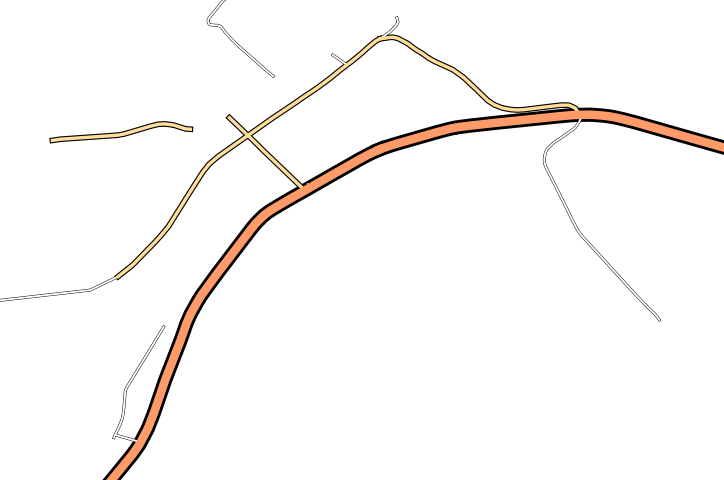
Once you have applied the style, take a look at its results on the map. As you can see, these symbols change direction along with the road but don’t always bend along with it. This is useful for some purposes, but not for others. If you prefer, you can change the symbol layer in question back to the way it was before.
3.2.11.3. Tipurile de Straturi pentru Simbolurile de tip Poligon
Pentru a vedea diferitele opțiuni disponibile pentru datele poligonale:
Schimbați tipul stratului simbol pentru stratul water, ca și mai înainte, în cazul celorlalte straturi.
Investigați ce pot face diferitele opțiuni din listă.
Alegeți una dintre ele, pe care o găsiți potrivită.
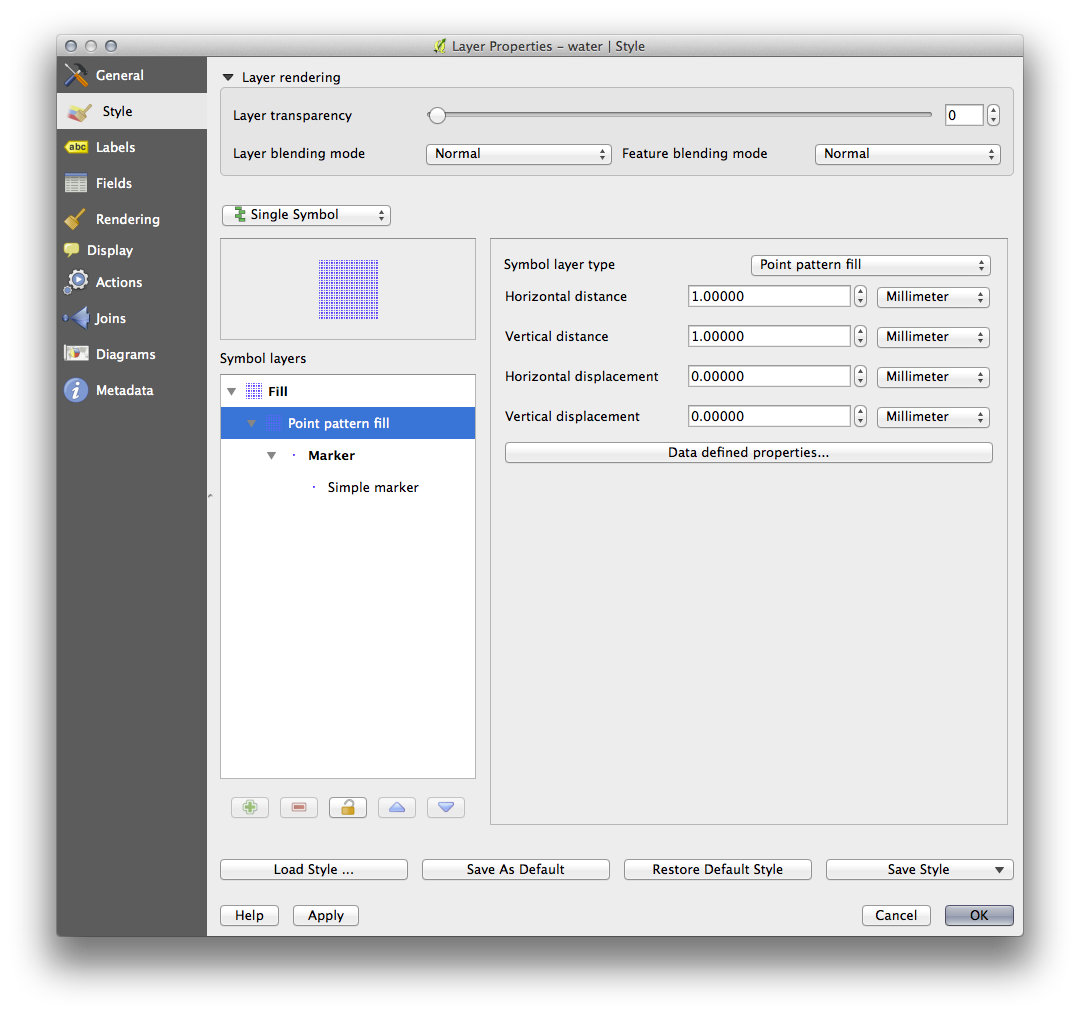
Dacă aveți îndoieli, utilizați Umplere cu model din puncte, având următoarele opțiuni:
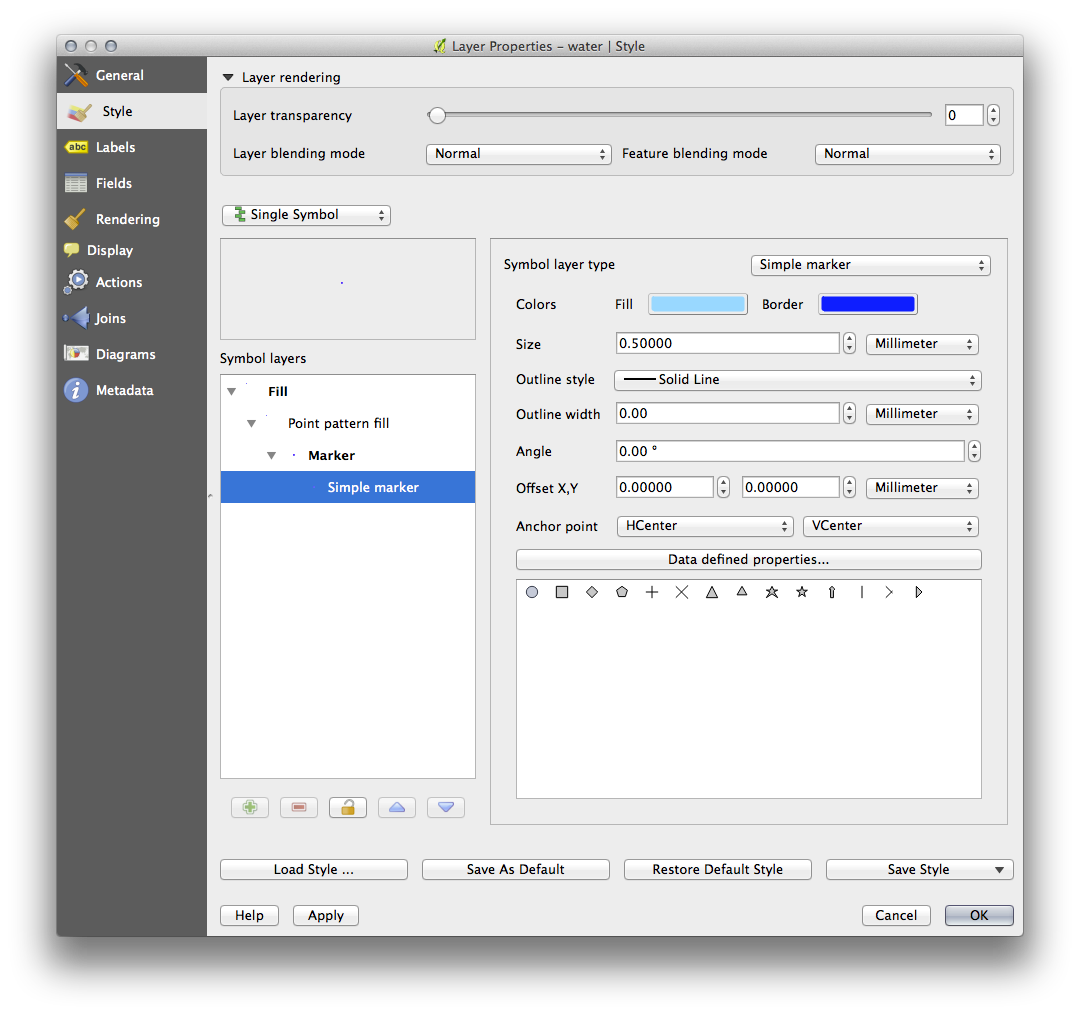
Adăugați un nou strat simbol, cu o Umplere simplă, normală.
Faceți-l în același albastru deschis, cu un chenar albastru mai închis.
Mutați-l sub stratul simbol cu modelul din puncte, cu ajutorul butonului Move down:

As a result, you have a textured symbol for the water layer, with the added benefit that you can change the size, shape and distance of the individual dots that make up the texture.
3.2.12. Try Yourself Crearea unei Umpleri pentru SVG Personalizată
Note
To do this exercise, you will need to have the free vector editing software Inkscape installed.
Lansați Programul Inkscape.
Veți vedea interfața de mai jos:
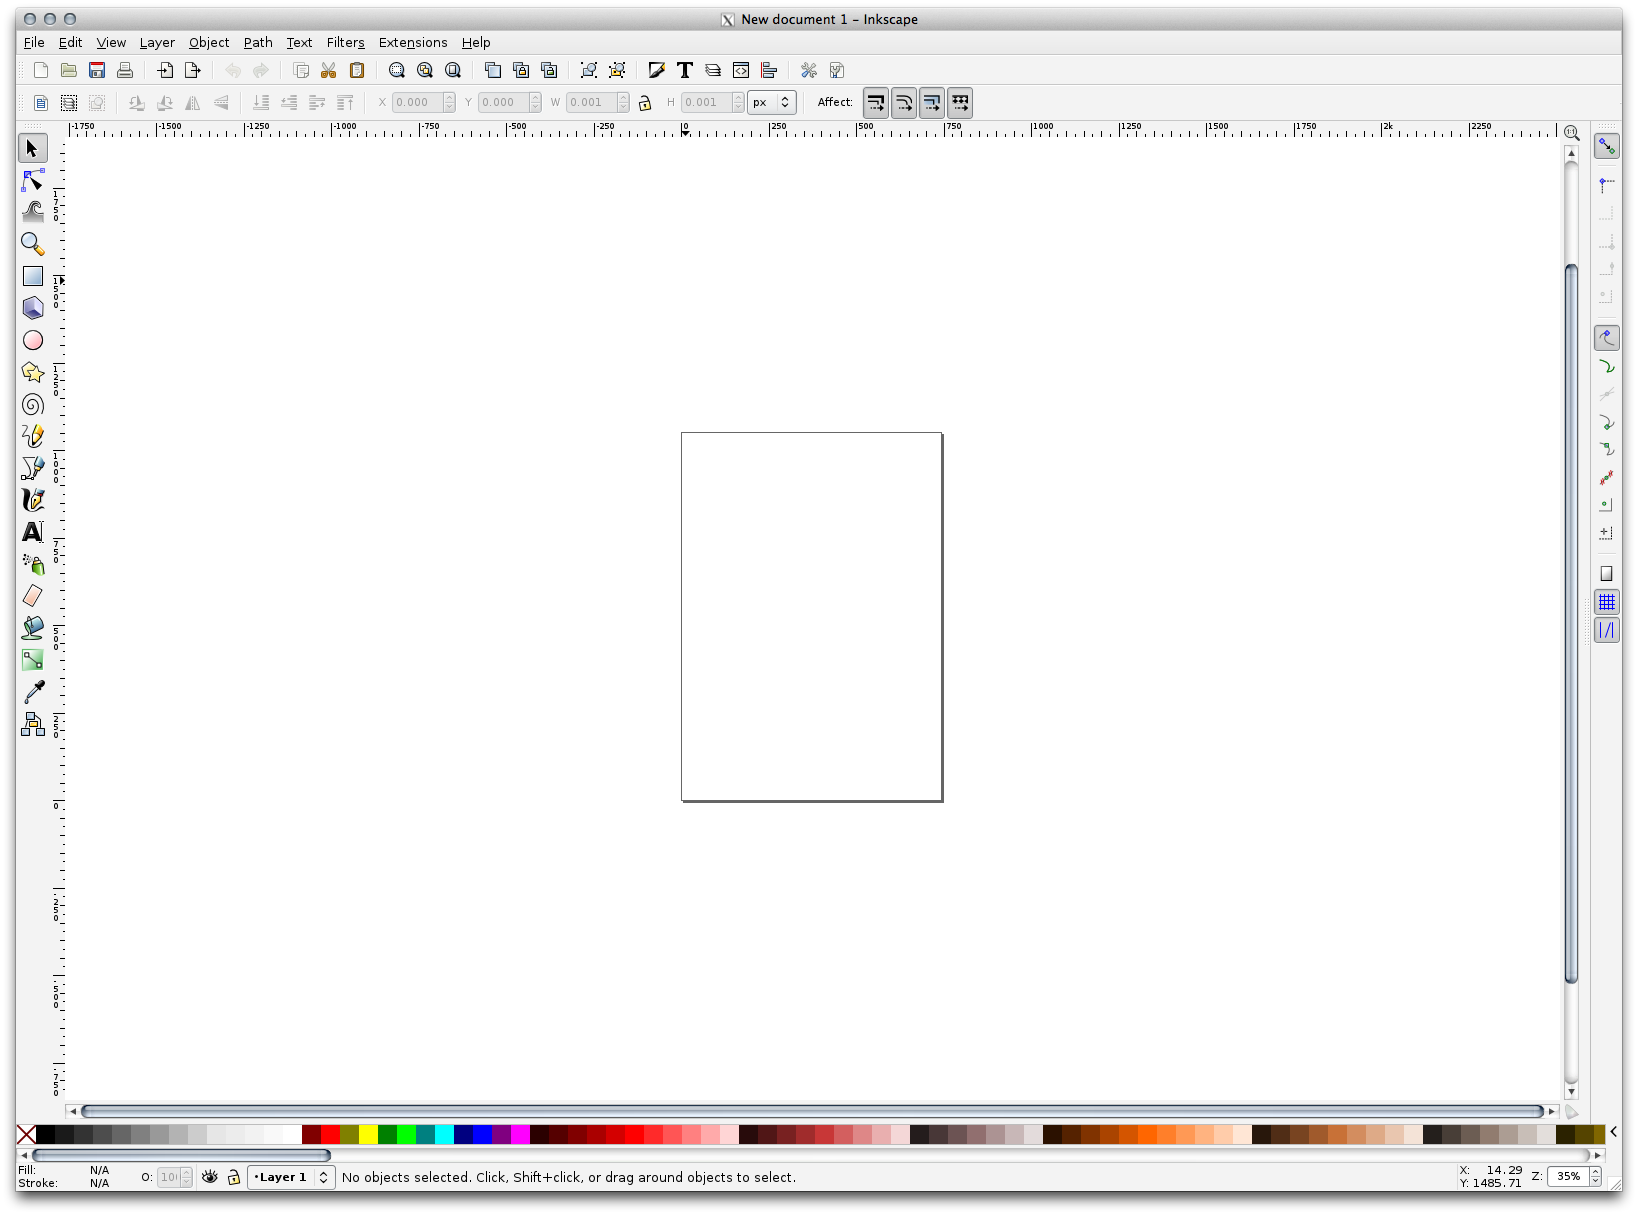
Ar trebui să vi se pară familiar dacă ați folosit alte programe de editare a imaginilor vectoriale, cum ar fi Corel.
În primul rând, vom schimba canevasul la o dimensiune adecvată pentru o mică textură.
- Click on the menu item File ‣ Document Properties. This will give you the Document Properties dialog.
Schimbați Unitățile în px.
Schimbați Lățimea și Înălțimea la 100.
Închideți dialogul, după încheiere.
Faceți clic pe elementul de meniu View ‣ Zoom ‣ Page pentru a vedea pagina la care lucrați.
Selectați instrumentul Circle:
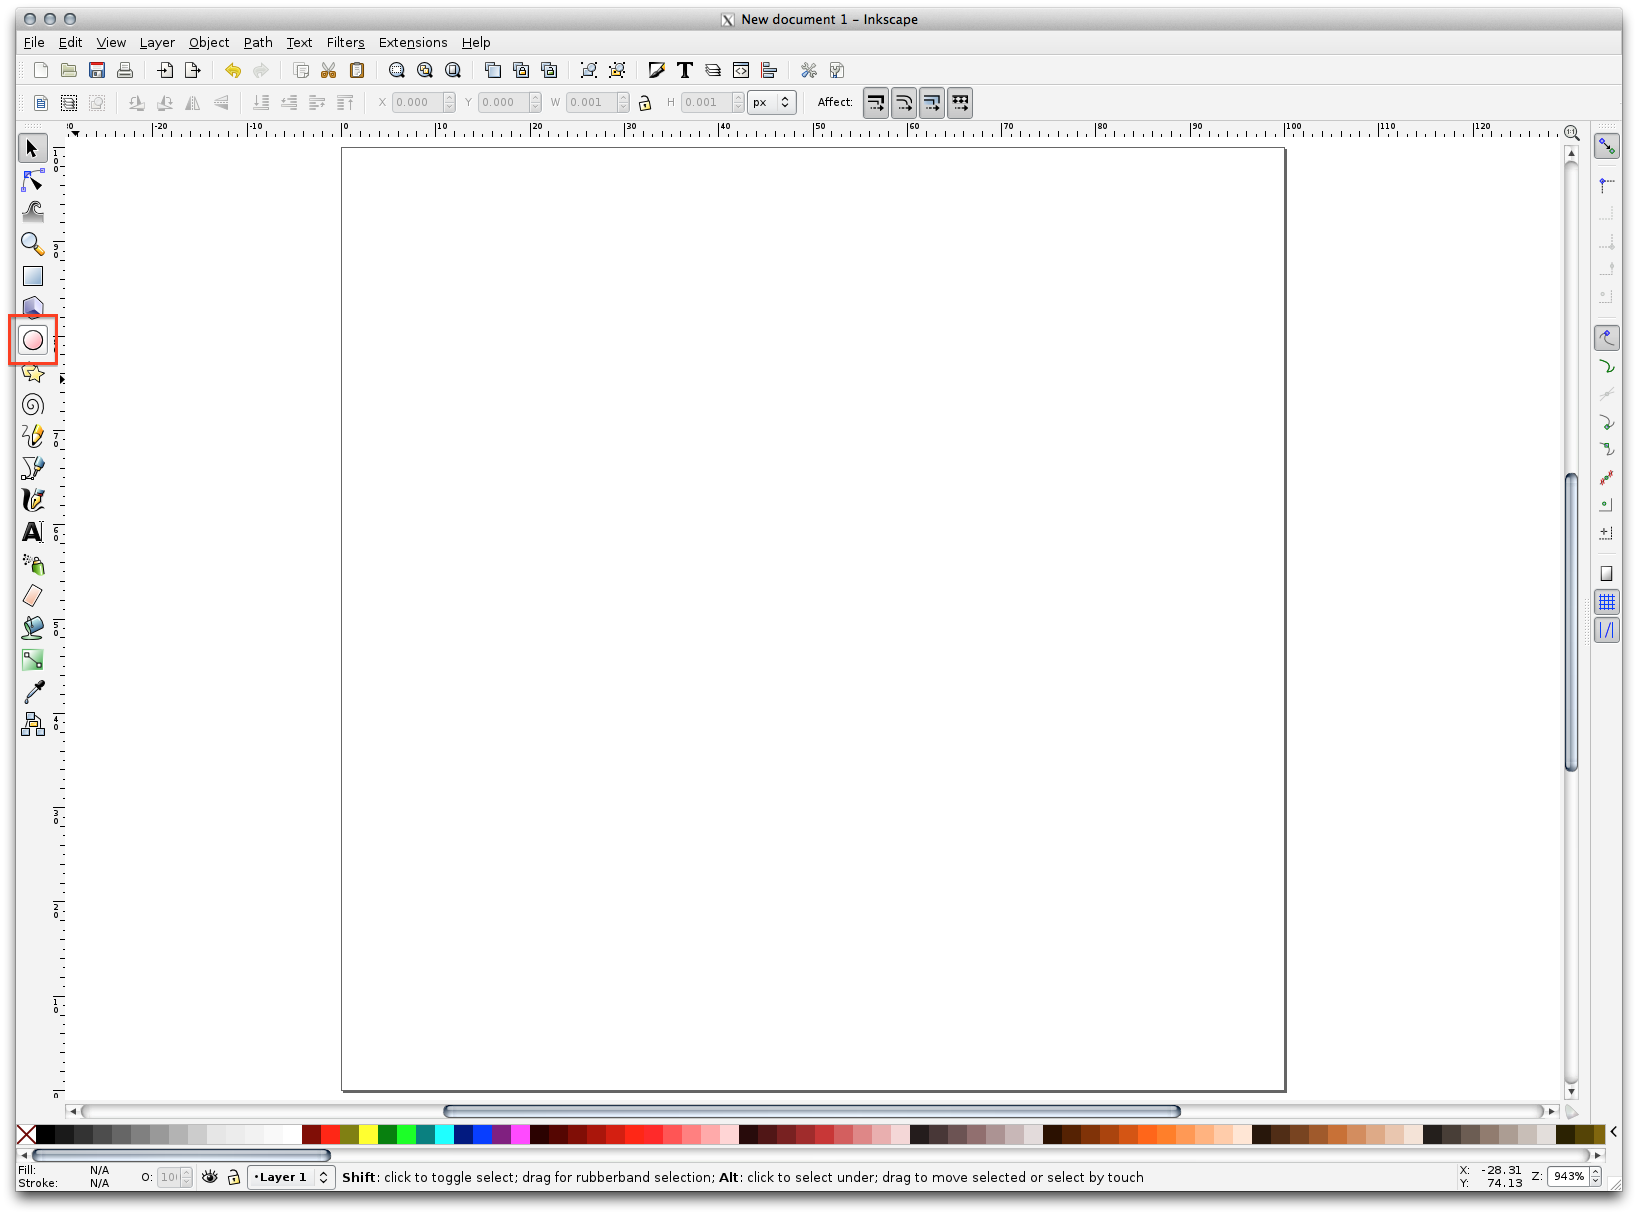
Mențineți apăsat butonul mouse-ului și trasați pe pagină o elipsă. Pentru a transforma o elipsă într-un cerc, mențineți apăsat și butonul Ctrl pe durata desenării.
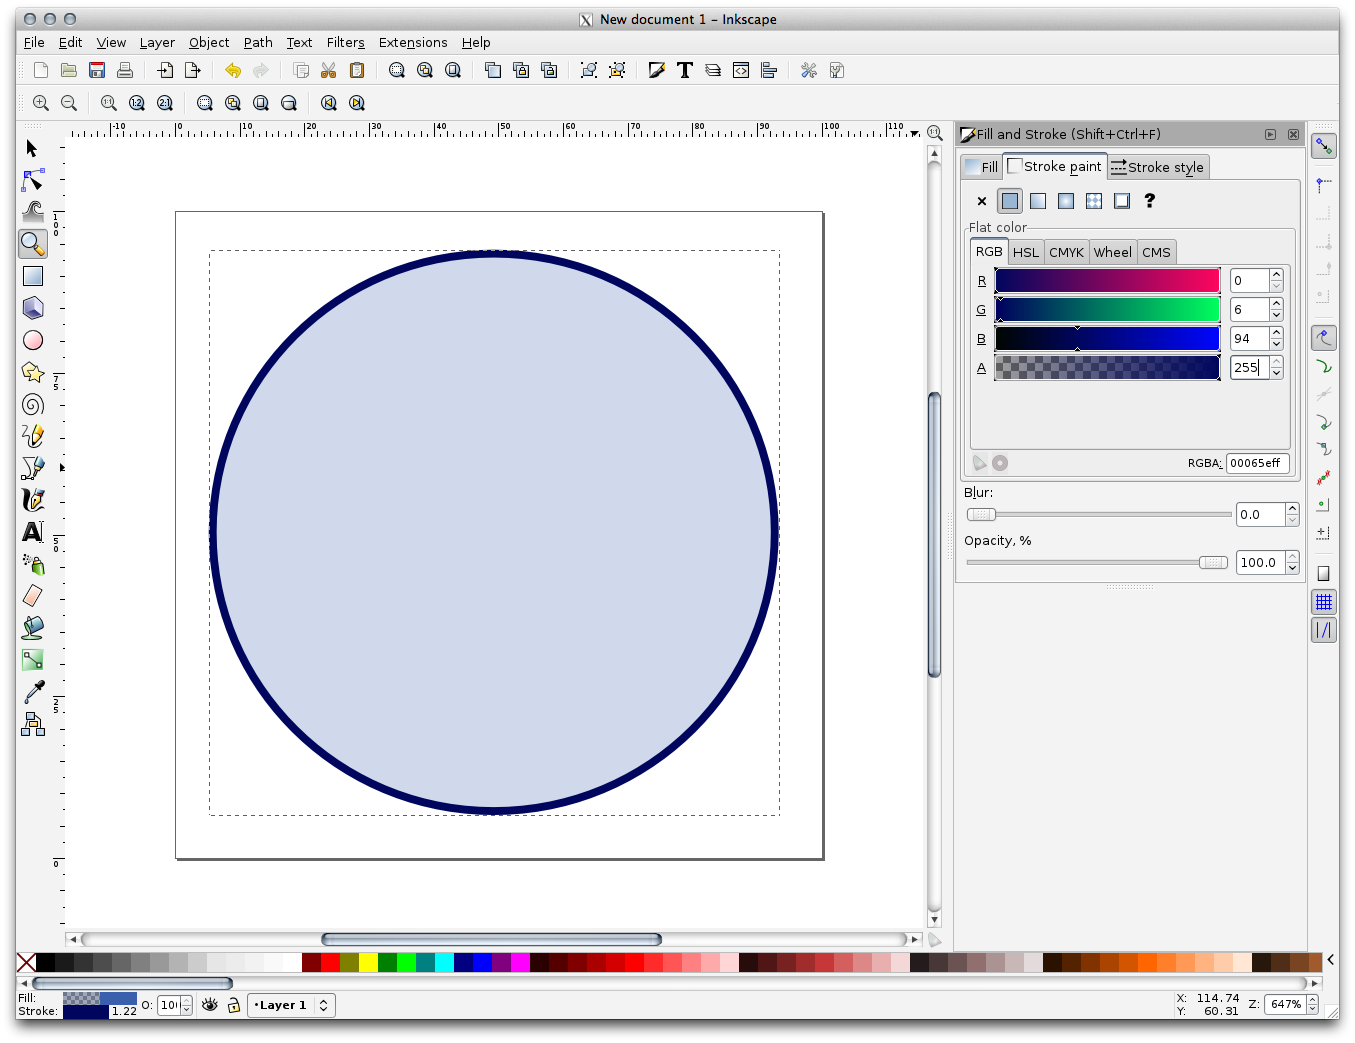
- Right-click on the circle you just created and open its Fill and
Stroke options. You can modify its rendering, such as:
Stabiliți pentru culoarea de Umplere o culoare albastru spre gri pal,
- Assign to the border a darker color in Stroke paint tab,
- And reduce the border thickness under Stroke style tab.
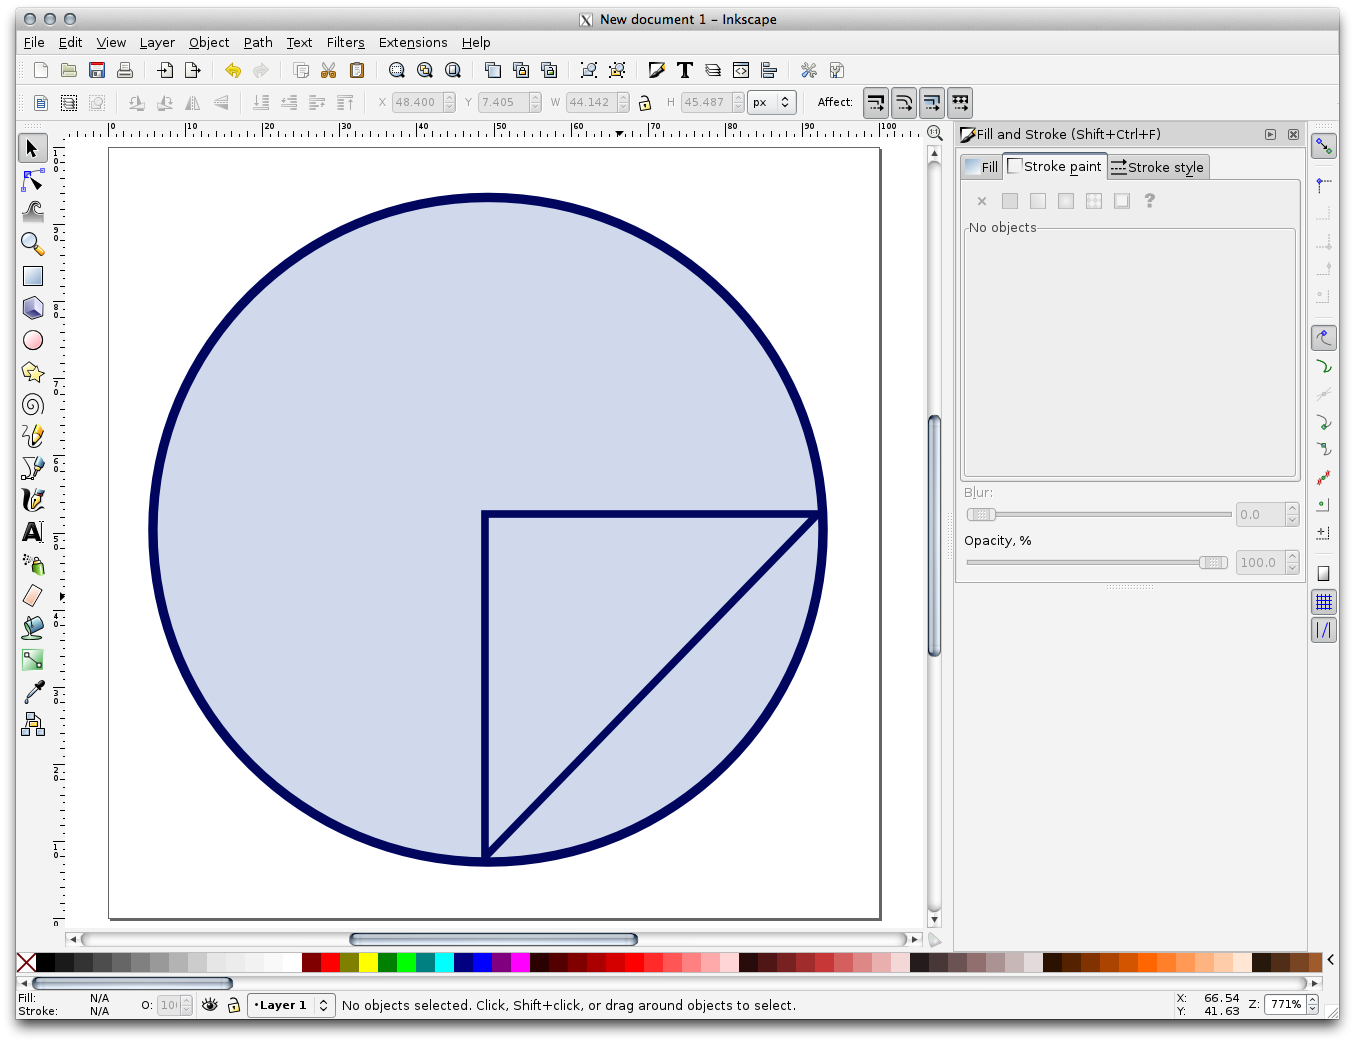
- Draw a line using the Pencil tool:
Faceți clic o dată pentru a începe linia. Rețineți apăsată tasta ctrl pentru o acroșare în trepte de 15 grade.
Deplasați indicatorul pe orizontală și puneți un punct cu un simplu click.
- Click and snap to the vertex of the line and trace a vertical line, ended by a simple click.
- Now join the two end vertices.
- Change the color and width of the triangle symbol to match the circle’s stroke and move it around as necessary, so that you end up with a symbol like this one:
- If the symbol you get satisfies you, then save it as landuse_symbol under the directory that the course is in, under exercise_data/symbols, as SVG file.
În QGIS:
- Open the Layer Properties for the landuse layer.
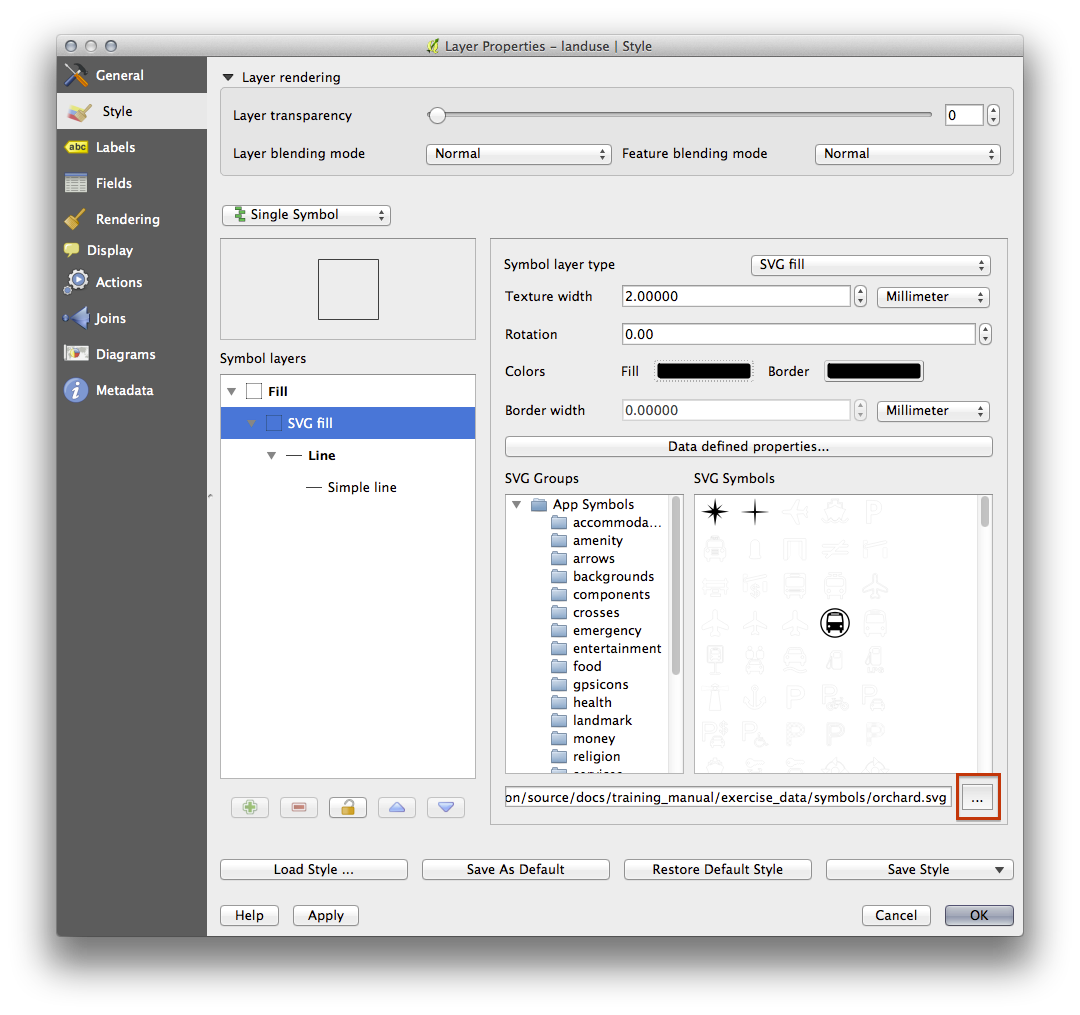
- In the Style tab, change the symbol structure by selecting SVG Fill as Symbol Layer Type option, as shown below.
- Click the
 Browse button to select your SVG image.
It’s added to the symbol tree and you can now customize its different
characteristics (colors, angle, effects, units...).
Browse button to select your SVG image.
It’s added to the symbol tree and you can now customize its different
characteristics (colors, angle, effects, units...).
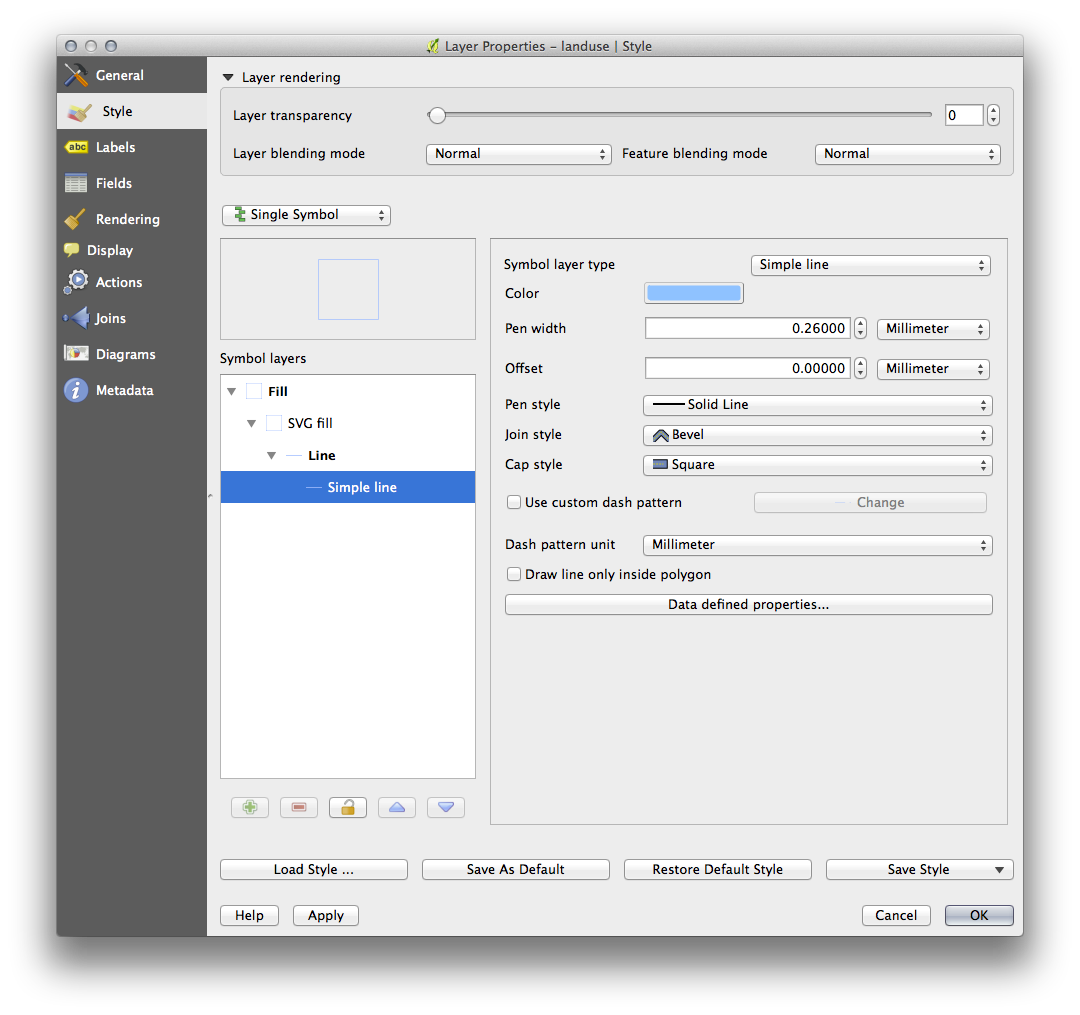
You may also wish to update the svg layer’s border (see below):
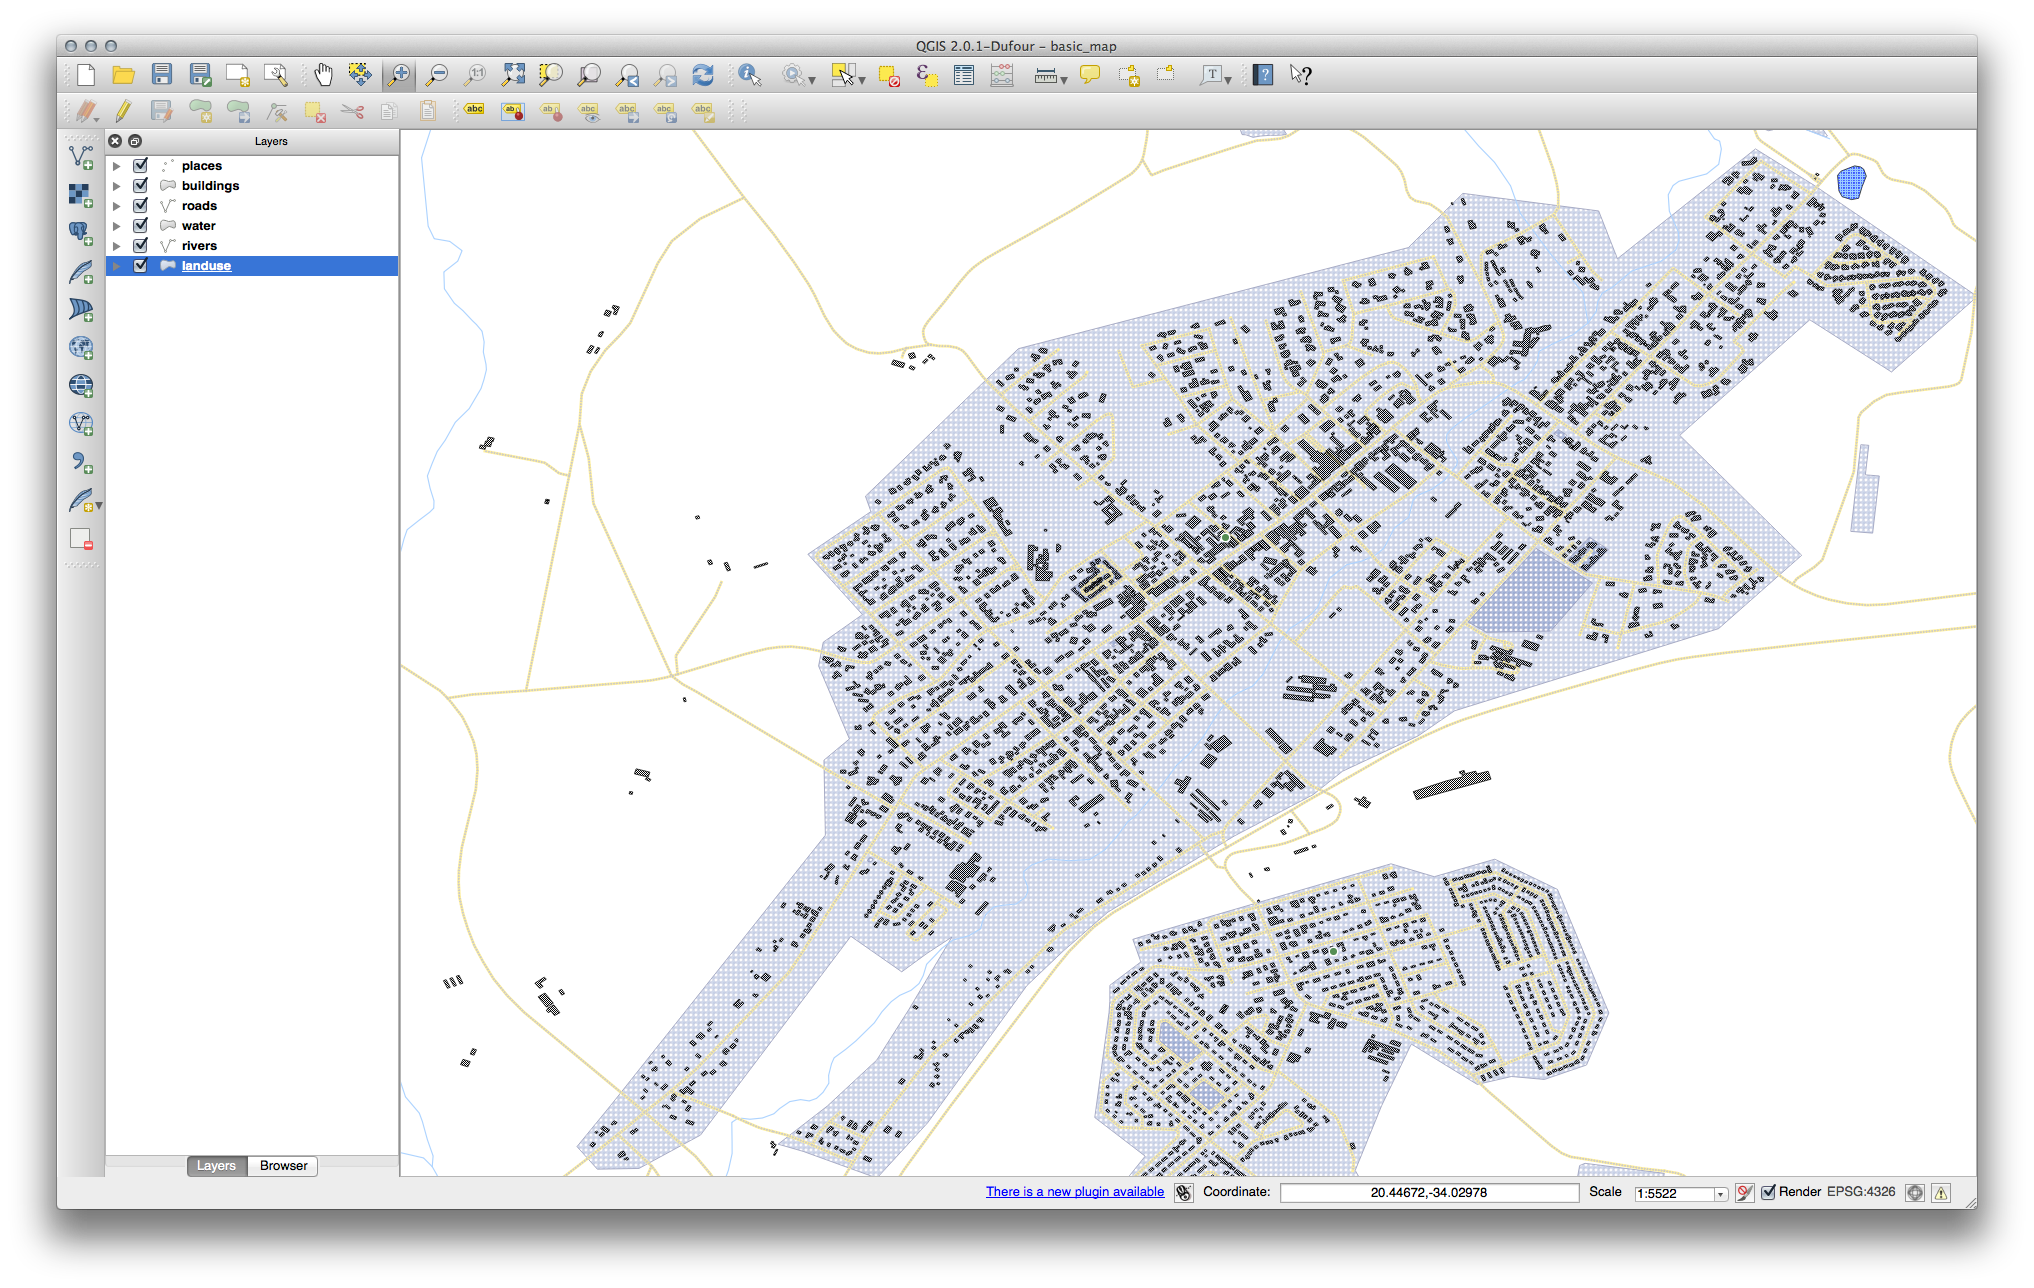
Once you validate the dialog, features in landuse layer should now be covered by a set of symbols, showing a texture like the one on the following map. If textures are not visible, you may need to zoom in the map canvas or set in the layer properties a bigger Texture width.
3.2.13. In Conclusion
Changing the symbology for the different layers has transformed a collection of vector files into a legible map. Not only can you see what’s happening, it’s even nice to look at!
3.2.14. Further Reading
3.2.15. What’s Next?
Changing symbols for whole layers is useful, but the information contained within each layer is not yet available to someone reading these maps. What are the streets called? Which administrative regions do certain areas belong to? What are the relative surface areas of the farms? All of this information is still hidden. The next lesson will explain how to represent this data on your map.
Note
V-ați amintit recent să efectuați o salvare a hărții?