9.2. Lesson: Combining the Analyses
Using the vectorized results of the raster analysis will allow you to select only those buildings on suitable terrain.
The goal for this lesson: To use the vectorized terrain results to select suitable plots.
9.2.1.  Try Yourself
- Save your current map (raster_analysis.qgs).
- Open the map in which you created during the vector analysis earlier (you should have saved the file as analysis.qgs).
- In the Layers list, enable these layers:
- hillshade,
- solution (or buildings_over_100)
- In addition to these layers, which should already be loaded in the map from when you worked on it before, also add the suitable_terrain.shp dataset.
- If you are missing some layers, you should find them in exercise_data/residential_development/
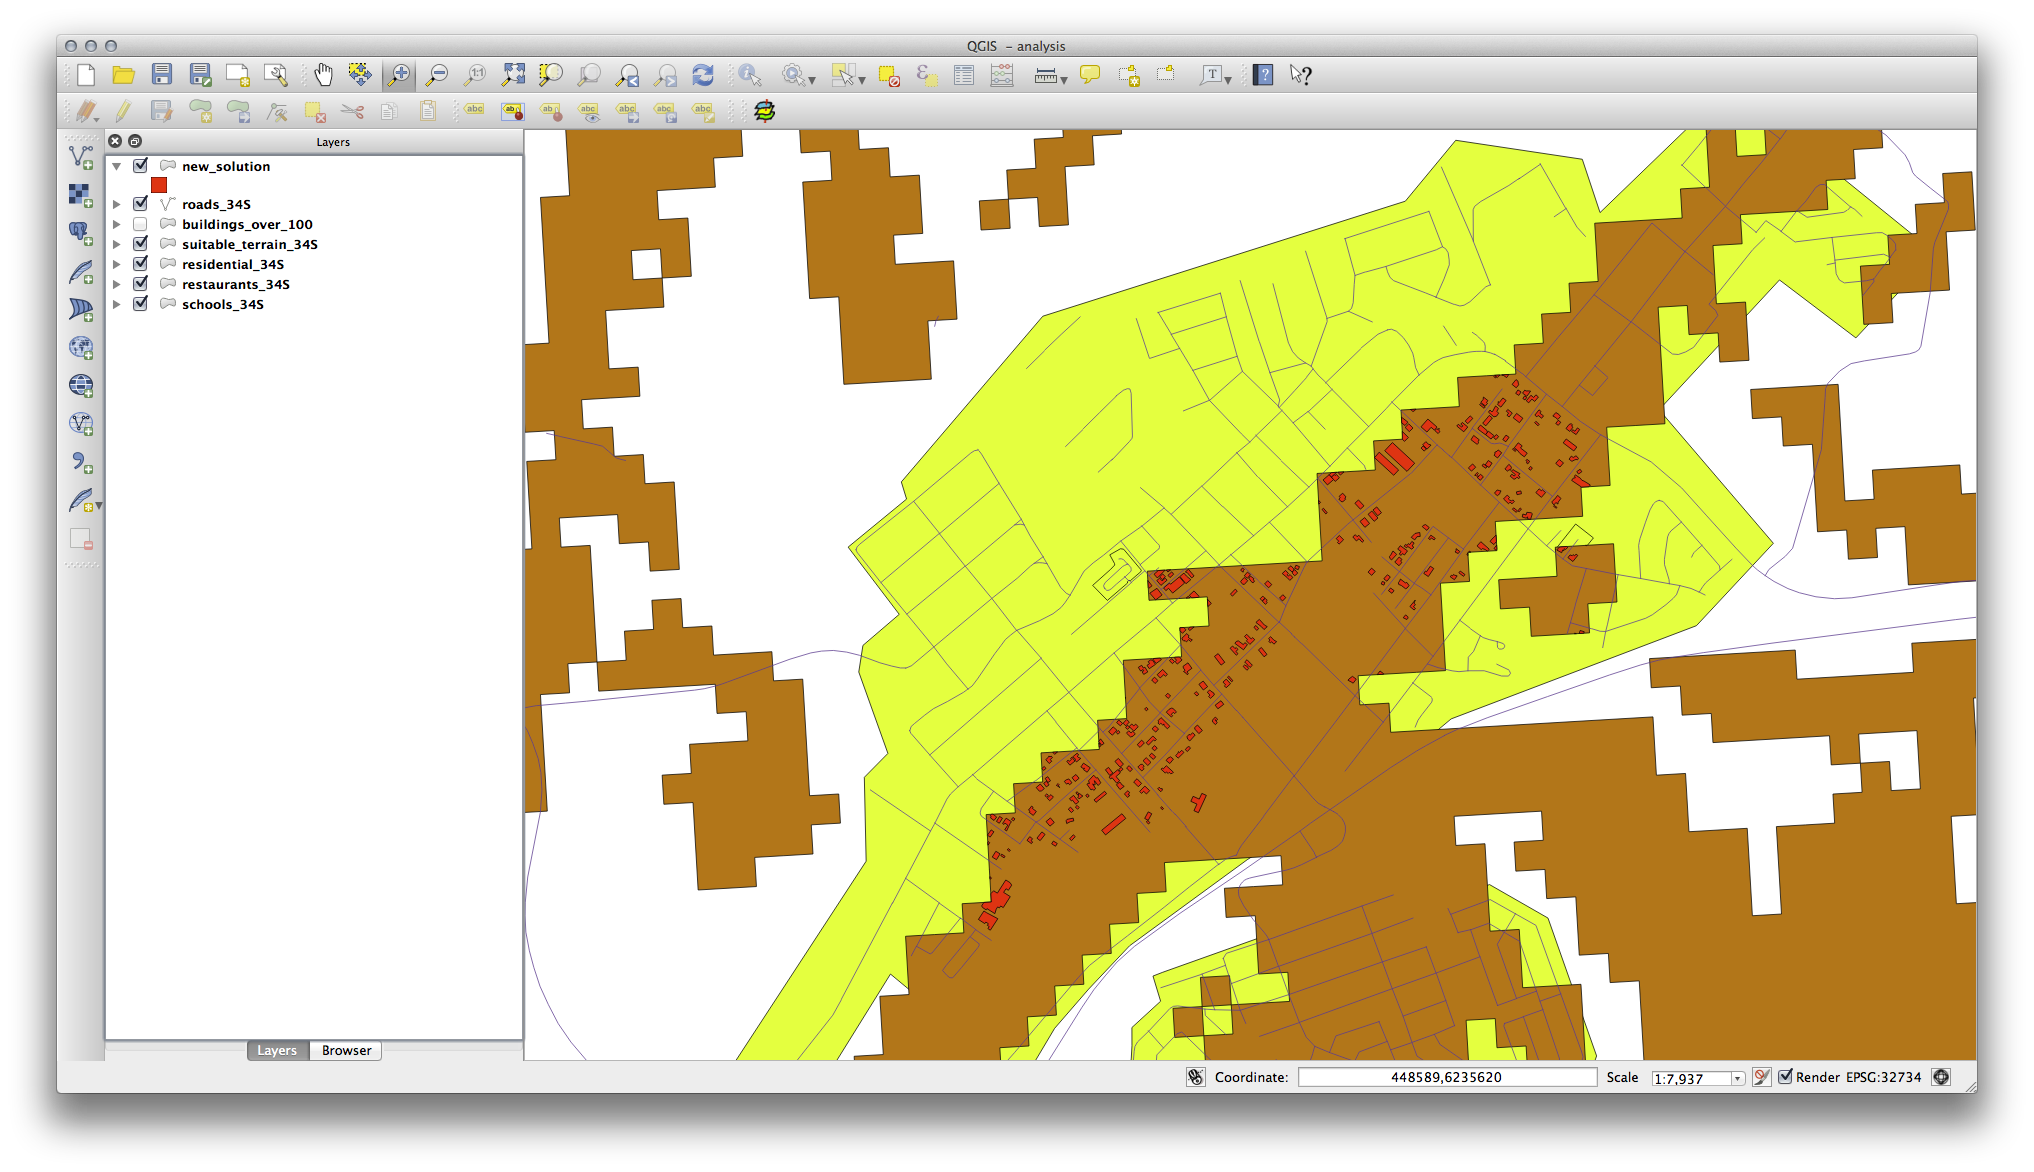
- Use the Intersect tool (Vector –> Geoprocessing Tools) to create a new vector layer called new_solution.shp which contains only those buildings which intersect the suitable_terrain layer.
You should now have a layer showing certain buildings as your solution, for example:
Note
If you find that the Intersect tool does not produce any results, check the CRS settings of each of your layers. The CRS must be the same for both the layers you are comparing. You may need to reproject one layer by saving the layer as a new shapefile with the required CRS. In our example, the suitable_terrain layer was reprojected to WGS 84 / UTM 34S and named suitable_terrain_34S.
9.2.2. Try Yourself Inspecting the Results
Look at each of the buildings in your new_solution layer. Compare them with the suitable_terrain layer by changing the symbology for the new_solution layer so that it has outlines only. What do you notice about some of the buildings? Are they all suitable just because they intersect with the suitable_terrain layer? Why or why not? Which ones would you deem to be unsuitable?
9.2.3. Try Yourself Refining the Analysis
You can see from the results that some buildings which were included were not really suitable, so we can now refine the analysis.
We want to ensure that our analysis returns only those buildings which fall entirely within the suitable_terrain layer. How would you achieve this? Use one or more Vector Analysis tools and remember that our buildings are all over 100m squared in size.
9.2.4. In Conclusion
You have now answered the original research question, and can offer an opinion (with reasons, backed by analysis) for a recommendation regarding which property to develop.
9.2.5. What’s Next?
Next you will present these results as part of your second assignment.